
How it works
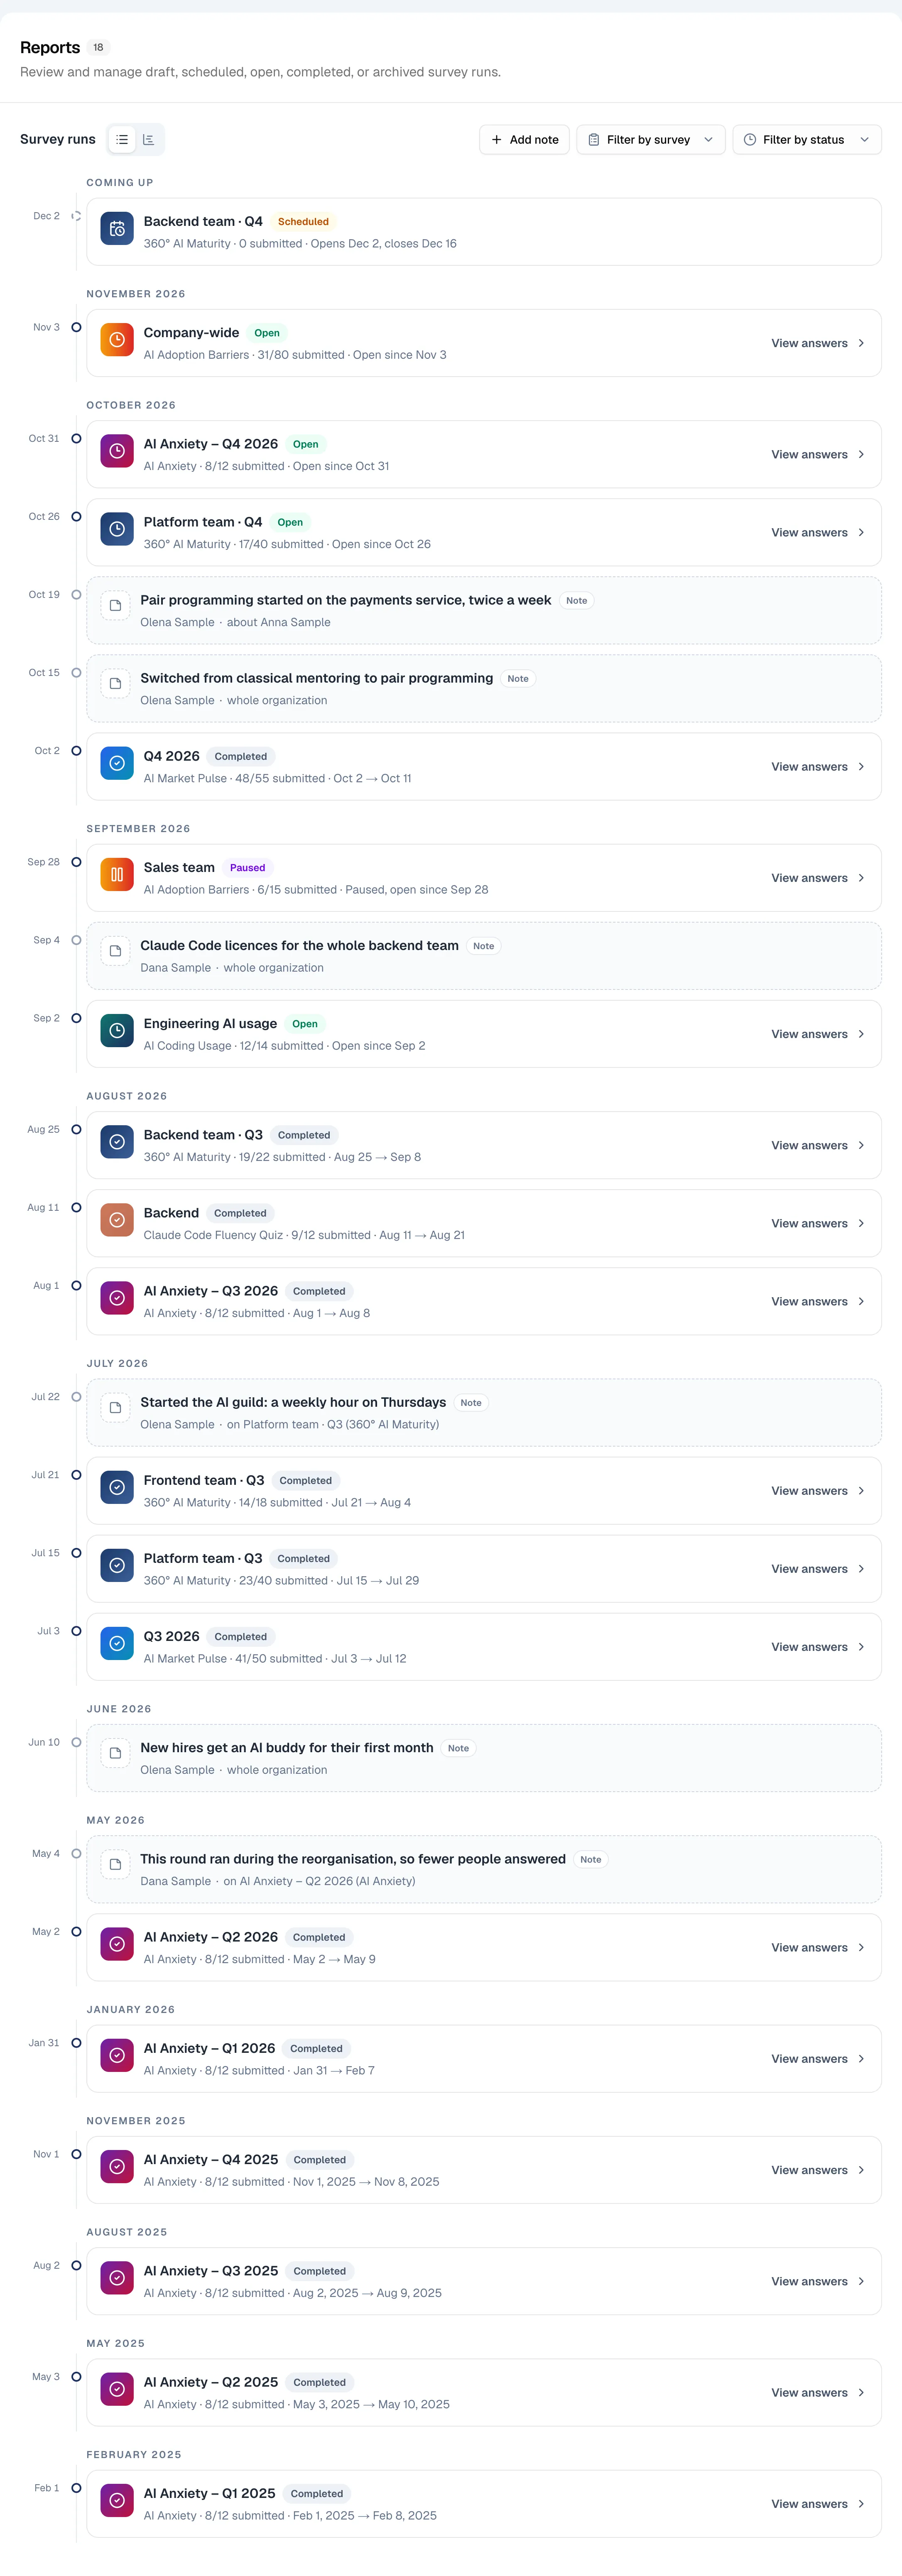
Open Reports in the app. Survey runs lists the reports you can open: the ones that closed, the ones still open and the ones scheduled to open. Switch between two views:
- List puts the reports month by month, newest first, with your notes between them.
- Timeline gives each survey a lane, so you see at a glance what ran when.
Both views filter by survey and by status.
List: month by month
Each report shows its dates and how many people answered. Reports that open later sit on top, under Coming up. A note shows on its day, between the reports around it, so you read what happened in the order it happened.
Timeline: a lane per survey
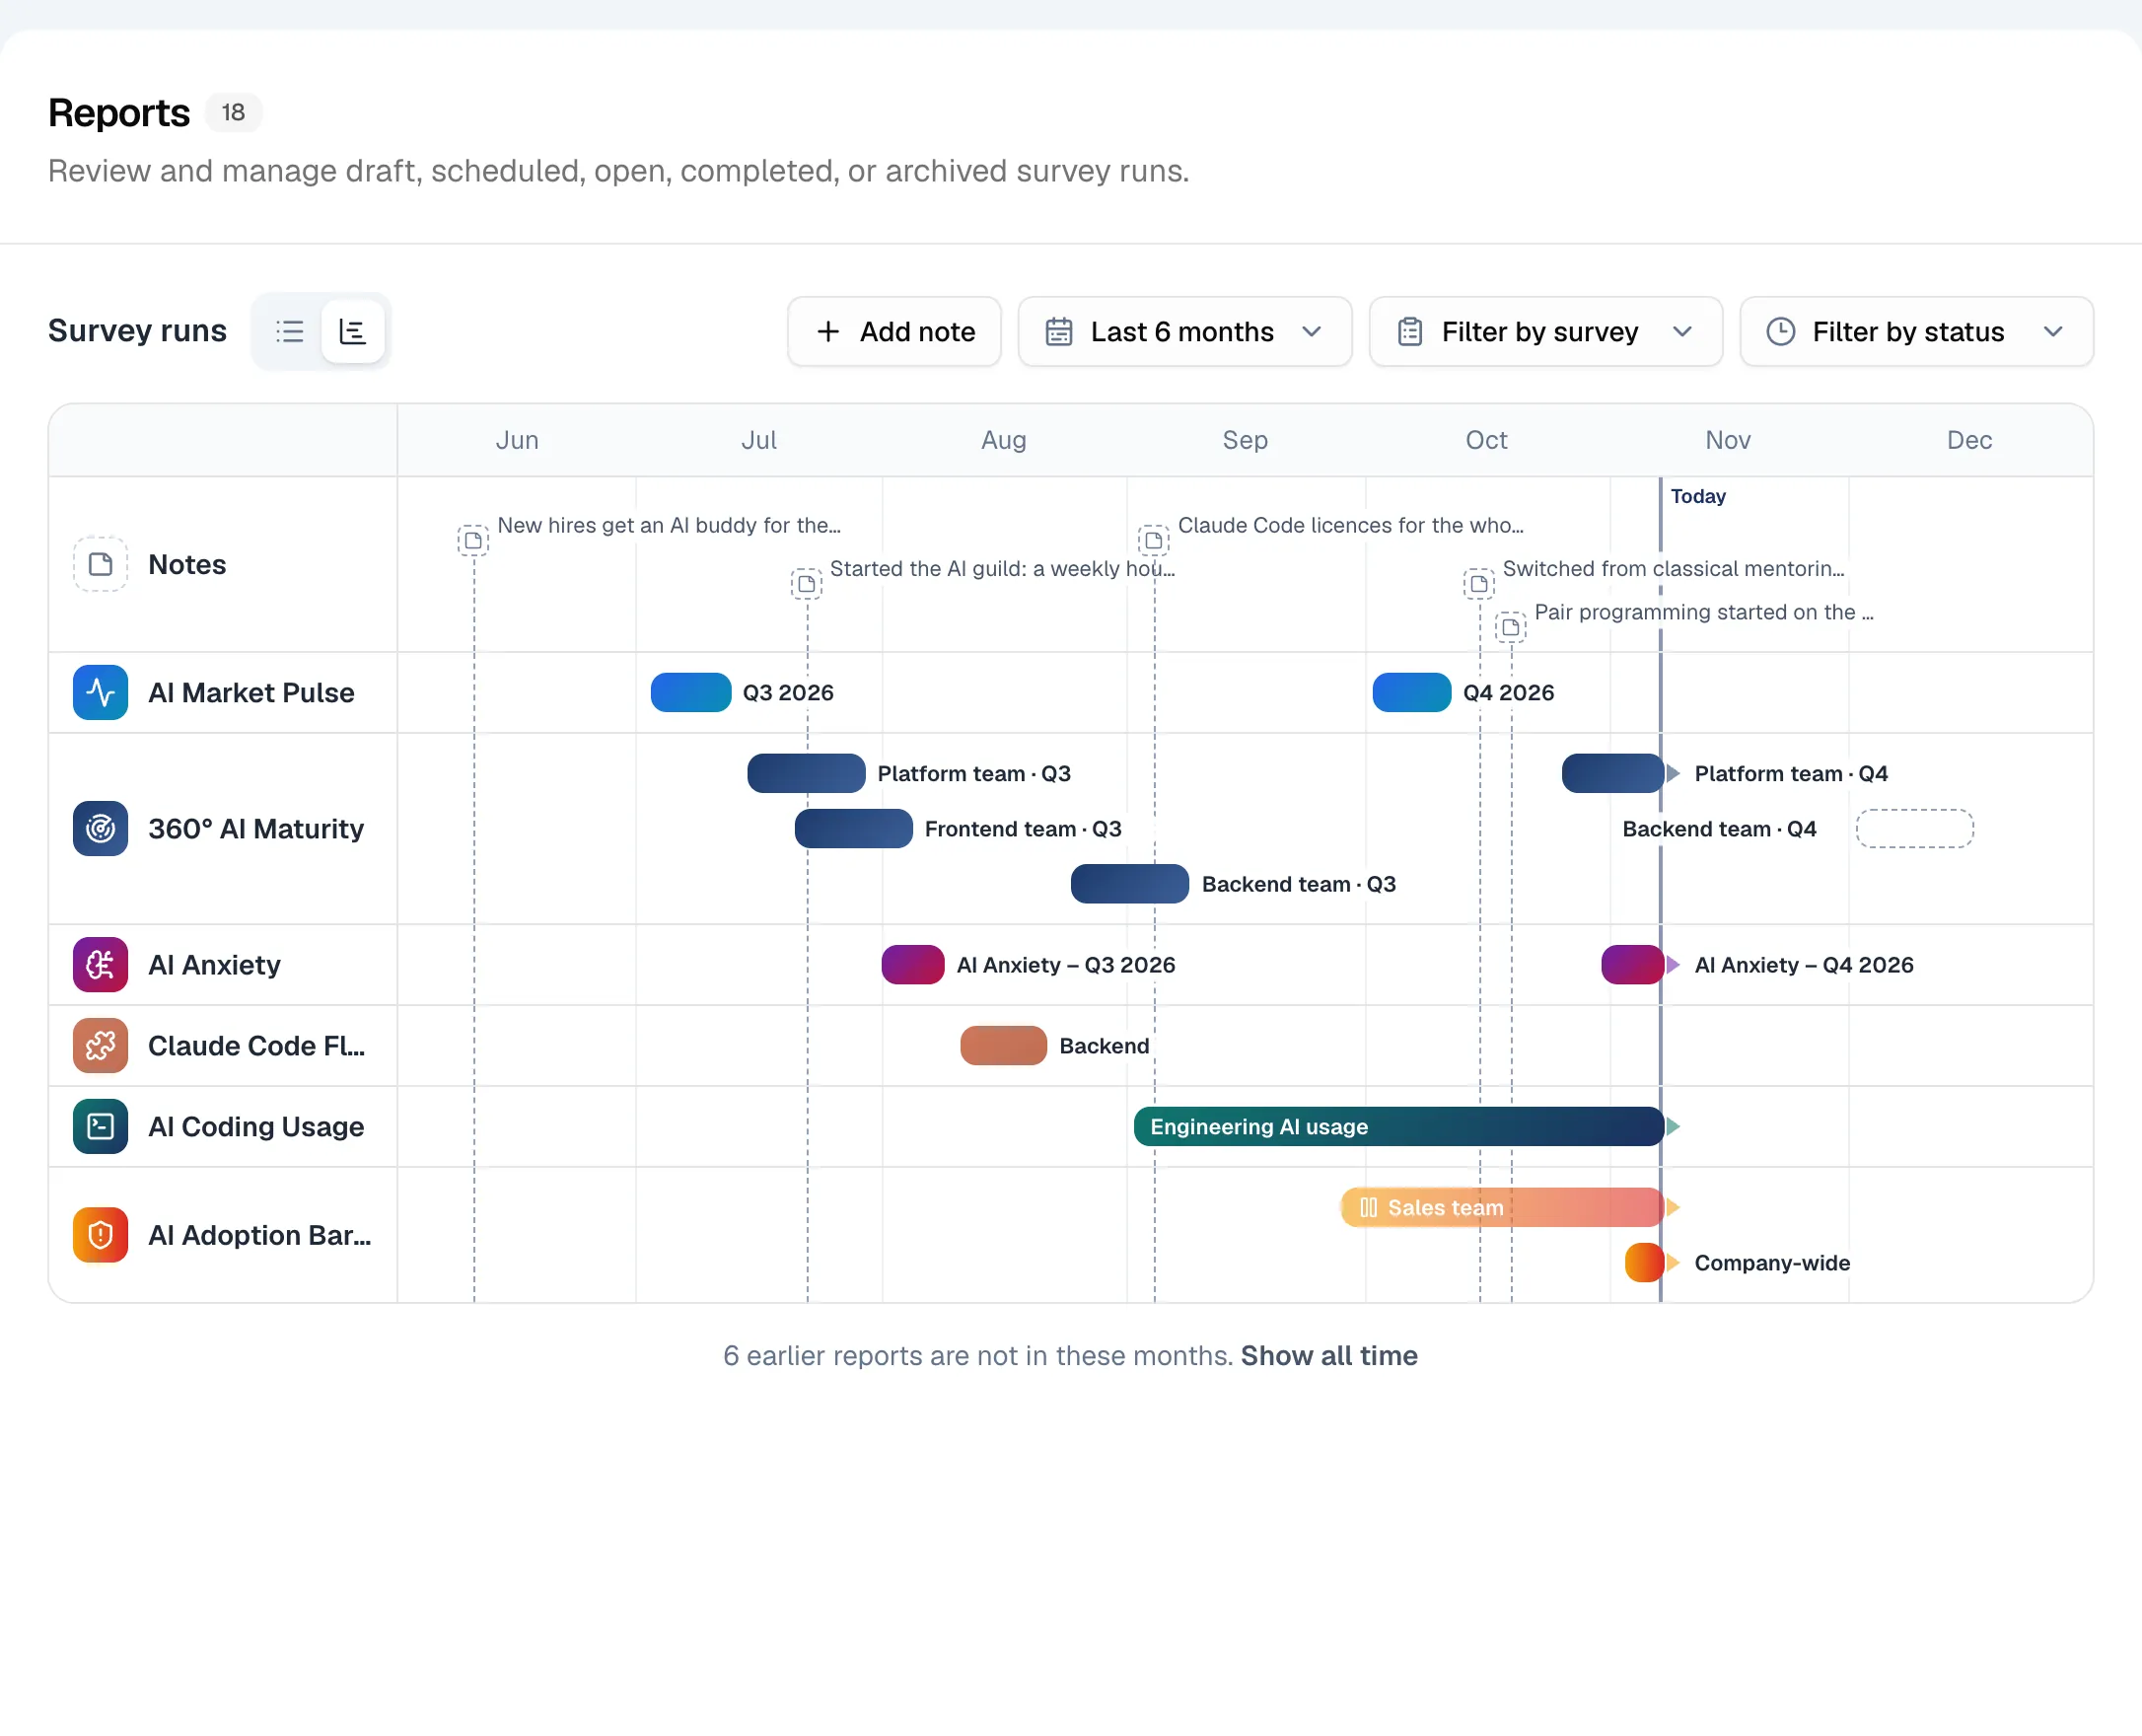
Months run across, and each report is a bar over the days it was open. Your notes have a lane of their own on top, with a line down to their day. Show the last 6 or 12 months, or all time.
Notes
Add note asks three things: what changed, the day, and what it's about. A note can be about the whole organization, one person or one report. For example: "We switched from classical mentoring to pair programming."
A note is one line that explains a date, up to 500 characters, with its author's name next to it. When the next round's results move, the reason is right there.
Add a note from Survey runs, from a report's ⋯ menu or from a person's page.
Where notes show
- On a report. "2 notes" under the report's name opens its notes: the ones about this report, about the earlier rounds its Trends compares, and the organization's from its first round to the day it closed.
- On the charts. The Trends charts of the 360°, SQM, AI Market Pulse and AI Anxiety pin each note on its day, and the Notes key hides them. AI Coding Usage pins notes on its charts of days and weeks, with the note in the chart's tooltip.
- On a person's page. Their reports read month by month, with the notes about them and the whole organization in between. Their AI Coding Usage page marks each note's day on the last 30 days.
- In the exports. A report's PDF and Markdown end with its notes: the day, the note, what it's about and who wrote it. A person's files end with the notes about them and the whole organization. The CSV leaves notes out.
- On the sample reports. Every sample report in the app has a few made-up notes, so you see where they show before you write your own.
Who sees and adds notes
- Notes about the whole organization are seen by everyone in it, except people invited only to view a report.
- A note about a report is seen by whoever can open that report, and a note about a person by whoever sees them in People.
- People who manage reports or surveys add notes. You can change or delete your own, and people who manage reports can change or delete any.
Who can open a report is on Live reports (opens in a new tab).
What it won't do
Change a result. A note sits next to the reports. It never changes their numbers.
Compare rounds. To see what changed from one round to the next, open a report's Trends tab: Trends over time (opens in a new tab).
Show notes to the people who answer. Notes are for the people who run the surveys, and a report's public link leaves them out.