
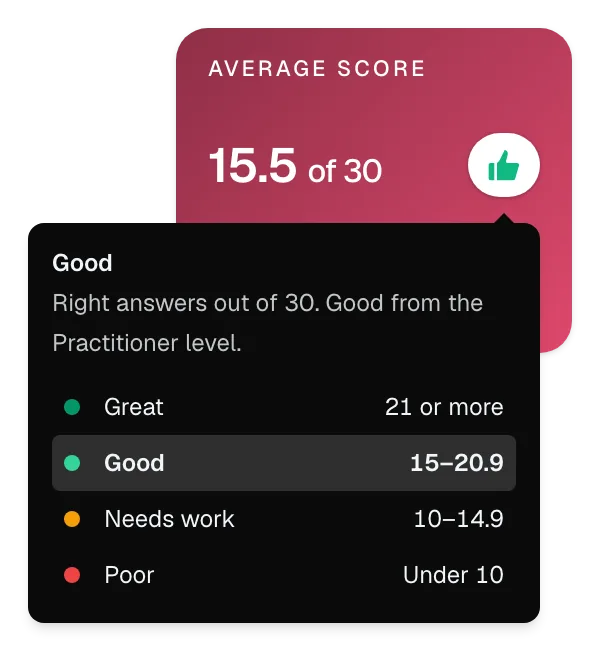
Examples
What one look at a card tells you. Cards from the sample reports, with fictional data, as the app shows them.
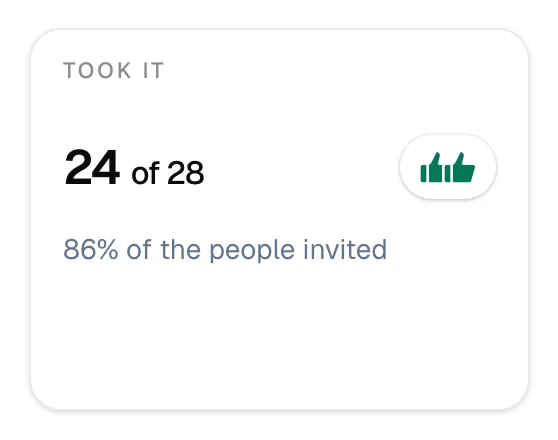
Two thumbs up: Great
24 of the 28 people invited took the quiz, 86%. Nobody needs chasing, and the results speak for nearly the whole team.
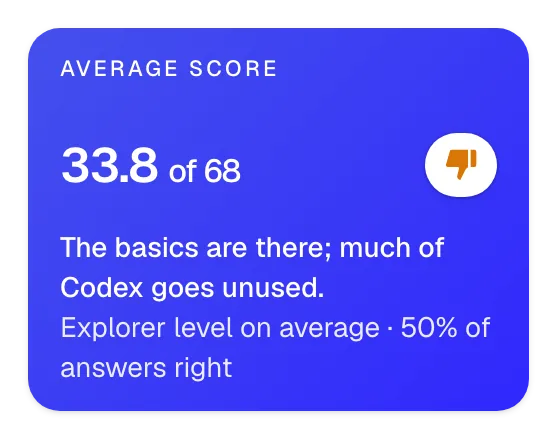
One thumb down: Needs work
33.8 out of 68 looks like the 15.5 out of 30 above, but here it's the Explorer level, a step below Good. The thumbs know each quiz's levels, so you don't have to.
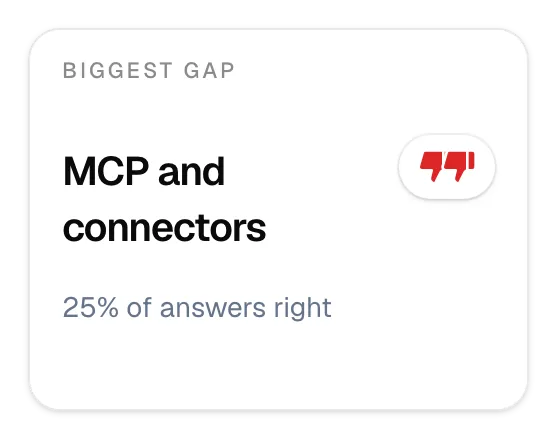
Two thumbs down: Poor
A quarter of the answers on MCP and connectors were right. The team's weakest area stands out at once, and that's where training starts.
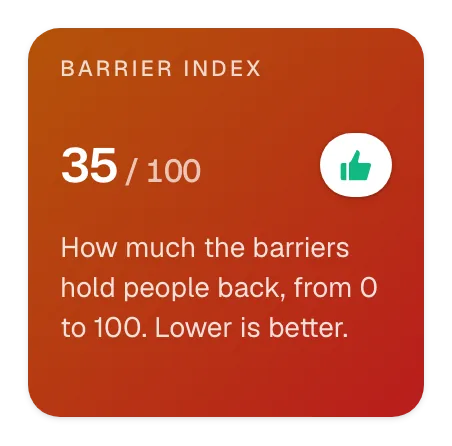
Up always means good
Here a lower number is better: 35 out of 100 means the barriers hold people back a little. The thumbs turn round for numbers like this, so a thumb up is always good news.
How it works
- On every report. Each key number in the Top summary has thumbs at its right, in the app and in its sample reports.
- The scale is a tap away. Hover or tap the thumbs to see each step's range and where this number falls.
- Each report's own scale. The quiz and 360° levels, where Practitioner is Good, SQM's score bands, the AI Anxiety Scale's concern levels and the market positions. Any other share is Great from 80%, Good from 60% and Needs work from 40%, the other way round where less is better.
- Where a number can be judged. Plain counts, such as how many people answered, and choices, such as the most wanted fix, get no thumbs, and neither does a person's page.
- In the PDF and your AI assistant too. The PDF shows the same thumbs with a key under the row, and the Markdown file and Claude or ChatGPT (opens in a new tab) get each rating in words.