
What's in a report
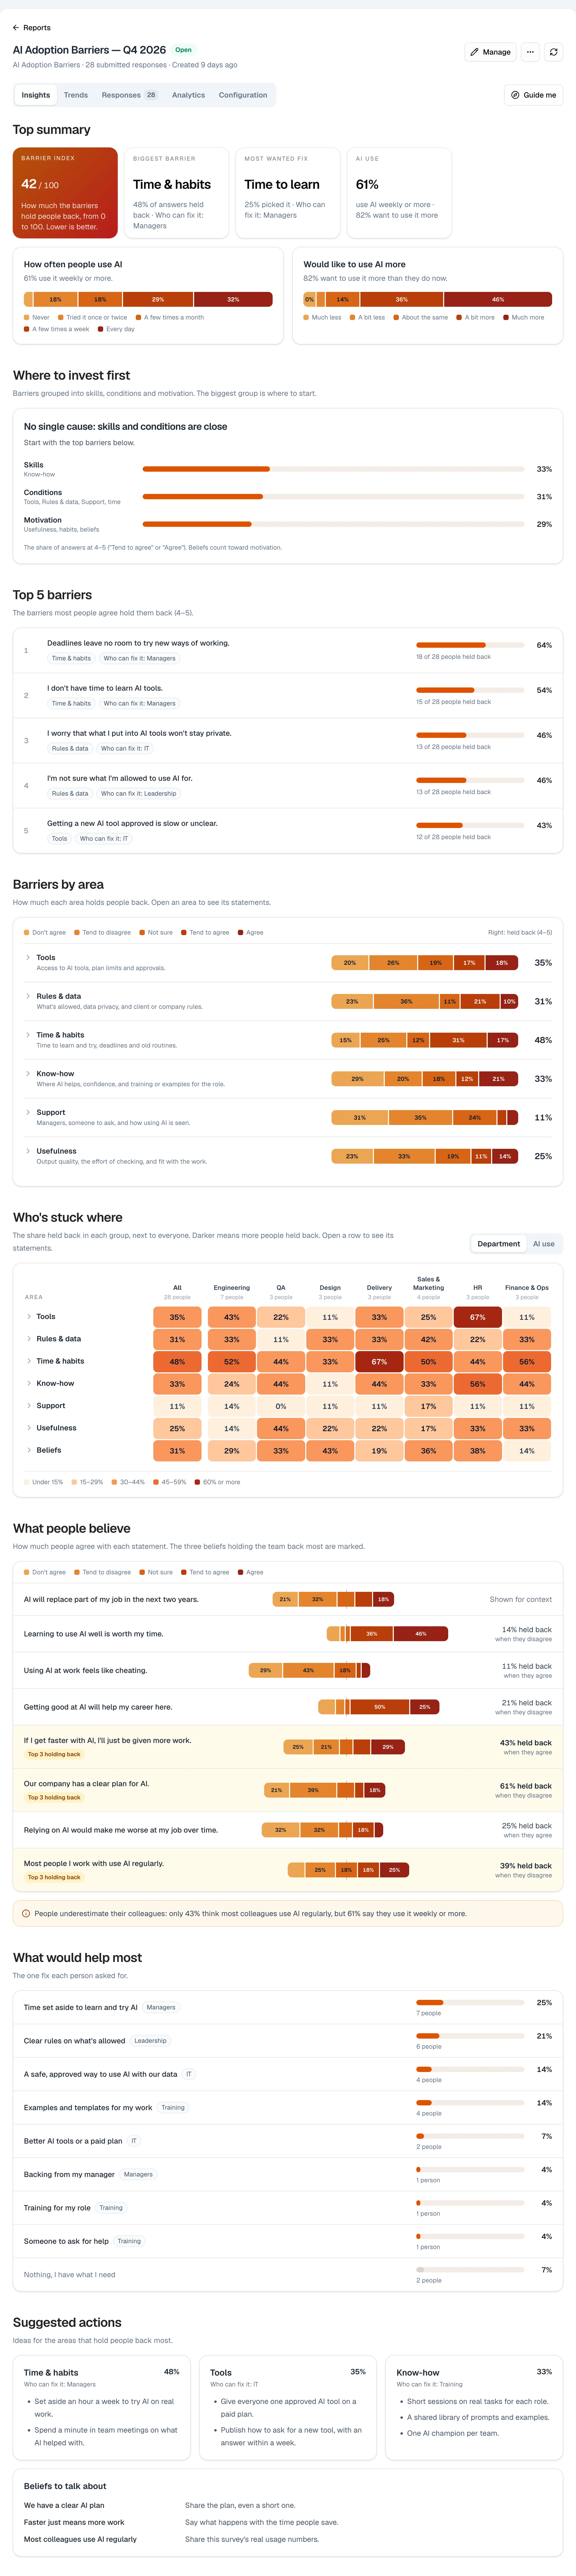
Every report has the same four tabs, whichever the survey. Pick one to see what it holds:
Each survey's page shows its own report in full, starting with AI Adoption Barriers (opens in a new tab) and the 360° AI Maturity Assessment (opens in a new tab). Every result follows fixed rules, which those pages explain: no AI writes a report.
While the survey runs
- From the first response. Insights appear once the first person submits. Until then, Responses shows the answers in progress.
- Current when you look. The report is worked out from the answers each time you open it. Press Refresh for the newest ones without leaving the page.
- Honest about small samples. With fewer than five responses, the 360° and AI Skills Distribution say the sample may not represent the wider organization.
- Every survey at a glance. The dashboard counts the surveys running, the responses submitted, the overall response rate and how many people you've reached.
Round after round
Run a survey again, as AI Market Pulse is meant to be every quarter, and its Trends tab sets the new round against the earlier ones. A survey's version never changes once it's published, so a finished round keeps the questions it was answered with, and rounds of the same version compare like with like.
Who answered, and where people stop
The Analytics tab follows people from opening the link to submitting, so you can see where a survey loses them: before they start, at the first question, or halfway through. For surveys sent to email lists, the funnel starts with everyone invited, and the reminders (opens in a new tab) go to the people who haven't submitted.
Analytics began recording link openings and each answer's time in October 2026, so surveys that ran before then show less.
Sharing
- Private to start. Only the person who launched the survey and your organization's admins can open a new report.
- Add people by name or email. A teammate gets an email with a link. Someone from outside joins as a Report viewer, who sees only the reports shared with them.
- Or open it to your organization: everyone who can view reports.
- A public link shows the report's Insights to anyone who has it, and not its Trends, Responses, Analytics or Configuration. Add a password if you like. Reset the link or turn it off at any time; it also stops working when the report is archived.
Everyone you share a report with in the app sees all of it, individual responses included. A public link shows results for the whole group, except on AI Skills Distribution, whose report is a directory of who can do what. Without a password, search engines may find a public link. More in Security and privacy (opens in a new tab).
With AI Adoption Score connected to Claude or ChatGPT (opens in a new tab), your AI assistant can read the reports you can open, and answer questions about them.
What it won't do
Export to a spreadsheet. Only SQM reports have Export PDF; there's no CSV or Excel export.
Hide small groups. There's no minimum group size: a department of two shows from its first answer.
Compare you with other companies. Trends compare your own rounds. There are no benchmarks across companies.
Update on screen by itself. Open the report again or press Refresh to see new answers.
Show every report on a public link yet. The 360°'s charts aren't on public links, and the skills assessments share their overview only.