
The short version
Surveys ask people how they use AI. This one measures it. Each engineer opens the survey link, signs in and pastes one line on their Mac. A small add-on then reads what Claude Code and Codex already record about each session, and when a session ends it sends that session's numbers to your report.
The report is built on four things: sessions, repositories, tools and connectors. Prompts, the AI's answers, code and file names never leave the Mac.
How it works
- Launch it like any other survey, and send the link to your engineers.
- Each person connects once. They open the link, sign in, read what is shared and press Connect. The page shows one line to paste into Claude Code, Codex or Terminal.
- They choose which repositories to share. The page lists the repositories they used, all ticked, and they untick any they keep to themselves. The add-on then shares the last 30 days of what they chose and adds a hook to each tool, so every session's numbers arrive when it ends, almost live, with nothing more to do.
- It stops when they say so. A person can disconnect on the survey page at any time, and closing the survey removes the add-on from every Mac on its next check.
What it counts
- Sessions: each Claude Code or Codex session, and the days people used AI.
- Repositories: the project each session ran in, so you see where AI is used.
- Tools: Claude Code or Codex.
- Connectors: the connected tools the AI called during a session, such as GitHub or Linear.
Every person sees exactly what is shared on the survey page before they connect, chooses which repositories to share, and can stop at any time.
What never leaves the Mac
- Prompts and the AI's answers
- Code and file names
- The text of commands
- Session titles
The add-on reads the tools' own records on the Mac and sends numbers about each session, never what was written in it. See Measuring AI coding usage for why we draw the line there.
What the report shows
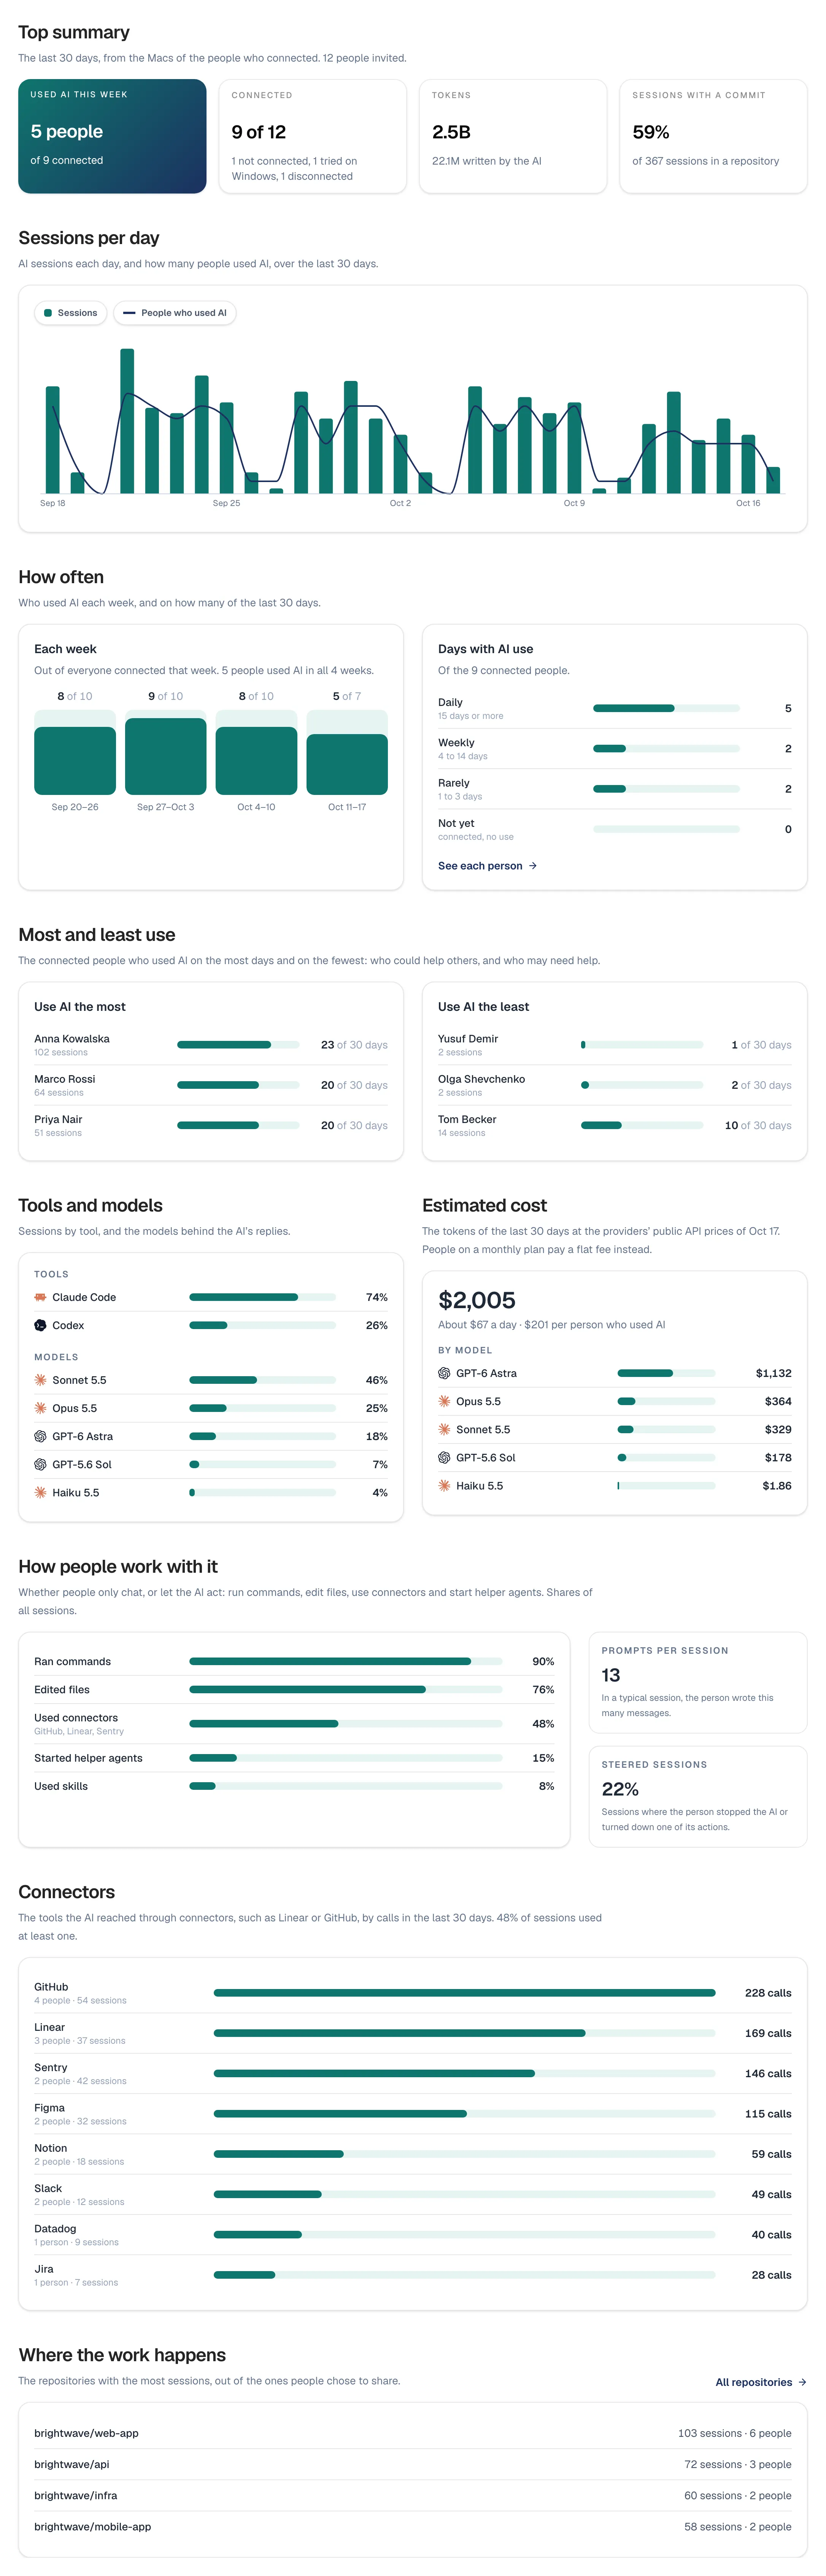
- Overview: who is connected out of everyone invited, who used AI this week, and sessions per day with how many people used AI each day.
- How often: people using AI in each of the last four weeks, and by days with use: daily, weekly, rarely or not yet.
- Most and least use: the people who use AI on the most days, who could help others, and those on the fewest, who may need help.
- Tools and connectors: sessions in Claude Code and in Codex, and the connectors the AI called, by how widely they are used.
- Repositories: every repository people chose to share, with its sessions and the people working in it, sortable, with filters for the days and the tool.
- People: everyone invited with a status and their last 30 days. Days when a Mac sent nothing show as gaps, not as no use.
- Export and AI: a PDF of the report, and the same numbers for Claude or ChatGPT through the AI connection, without anyone's name.
Who sees what
- Only the repositories people choose. Sessions in a repository someone unticks never leave their Mac, and the names of the repositories they untick are deleted as soon as they choose.
- Named or anonymous. With a Google sign-in the report names each person; with a shared password it can ask for an email or keep people anonymous.
- For enablement, not reviews. The numbers show where AI helps and where people need support. They aren't a measure of anyone's performance.
Limits
- Mac only, for now. People who open the link on Windows are counted, so you know how many are waiting.
- Claude Code and Codex. Other AI tools aren't counted yet.
- Use, not quality. It shows how much and where people use AI, not whether the work is good.
- Gaps aren't zeros. A Mac that was off sends nothing that day, and the report says so rather than counting it as no use.