
The short version
Everyone answers about 15 minutes of questions on how they use AI, on a questionnaire for their role. Each answer is worth 1 to 5 points, and the points become five scores: Usage, Skills, Impact, Culture and Vision.
The mean of the five gives a level, from L1 Observer to L5 Native. Their shape gives an archetype, such as Tool Operator or Habit Builder, which says more about what to do next than the level does.
Every person, team and the organization gets both, with the gaps behind them and three suggested goals.
Five dimensions
Someone can use AI all day and get little out of it, or know it well and keep it to themselves. One score would hide both, so the 360° scores five dimensions separately.
Two sub-scores sit next to them on the report's maturity map. Data averages the questions on giving AI context, checking its output and building it into workflows; Governance, the ones on shared practices, sensitive data and practices that outlast the people who started them. Neither counts toward the score.
Two questionnaires
An engineer and an account manager use AI for different work, so one set of questions would miss half of it. Each person picks the questionnaire that fits their role, and can change their pick later.
36 questions are the same on both, so both land in one report on the same scale. Each takes about 15 minutes, and the first screen says there are no right or wrong answers: it isn't a test of technical knowledge. A round can also offer just one of the two.
Before the questions, About you asks for a department, a seniority and projects, from lists you set for the round. The report groups people by them. The last question is open and optional: What is the biggest thing stopping you from using AI more in your work? The report sorts the answers by theme.
From answers to a score
- Each answer is worth 1 to 5 points. On a rating question, the five answers are five steps, like the questions above. Lists, such as the AI tools someone used last month, are scored by rule: agents like Claude Code count more than coding assistants, those more than chat, and using several kinds adds a little.
- A dimension's score is the mean of its scored answers. An answer that doesn't apply, like "Coding isn't part of my role", is left out rather than counted as zero.
- The overall score is the mean of the five dimensions, each weighing the same.
- The overall score sets the level, with the same cut-offs for a person, a team and the organization.
Not every question is scored: 44 of the 57 on the Delivery & Engineering questionnaire, and 53 on Business. The rest, such as which effort level someone uses or what support they want, feed the report's charts and signals.
Try it
Move the five scores to see where the level and the archetype go. The rules are the ones the report uses.
The balanced level. A high score in one dimension can make up for a low one. So each person's page also shows a balanced level, capped by their weakest dimension: below 2.0 allows at most L1, below 2.8 L2, below 3.6 L3 and below 4.2 L4. The levels of teams and the organization are never capped.
Five levels
The overall score places everyone on one of five levels. The cut-offs are the same for a person, a team and the whole organization, each from its own mean.
The report's top summary counts the people at L4 or L5, and Trends shows how that share moves from one round to the next.
Eight archetypes
Two people at L3 can need opposite things: one uses AI all day but keeps it to themselves, the other shares everything but gets few results. The archetype names the shape of the five scores. The same eight shapes describe a person, a team or the whole organization, which gets one from its average scores.
How the archetype is chosen
The rules are checked in this order, and the first that fits gives the archetype:
- AI Native: every dimension at 4 or more.
- Early Explorer: every dimension below 2.5.
- Visioneer: Vision at 3.4 or more and Culture at 3 or more, while Usage and Impact are below 2.8.
- Skeptical Performer: Usage at 3 or more and Impact at 2.8 or more, while Culture is below 2.8.
- Outcome Hunter: Impact at 3.5 or more, while Culture is below 2.8.
- Tool Operator: Usage at 3.5 or more, while Culture is below 2.8, Vision below 3.2 and Impact below 3.5.
- Individual Expert: Skills at 3.5 or more, while Culture is below 2.8.
- Habit Builder: Culture at 3.2 or more, Usage, Skills and Impact at 3 or more, and an average of 3.1 or more.
When none fits, it's the archetype whose typical profile is closest.
What a team is missing
AI sticks in a team when four kinds of people are in it. The Teams view counts them and, when one is missing, says which archetype would fill the gap.
What the report shows
The report fills in with every submitted response. Its Insights tab has three views. The Organization and Teams views each have a short Must-know version and a Deep analysis that adds every question.
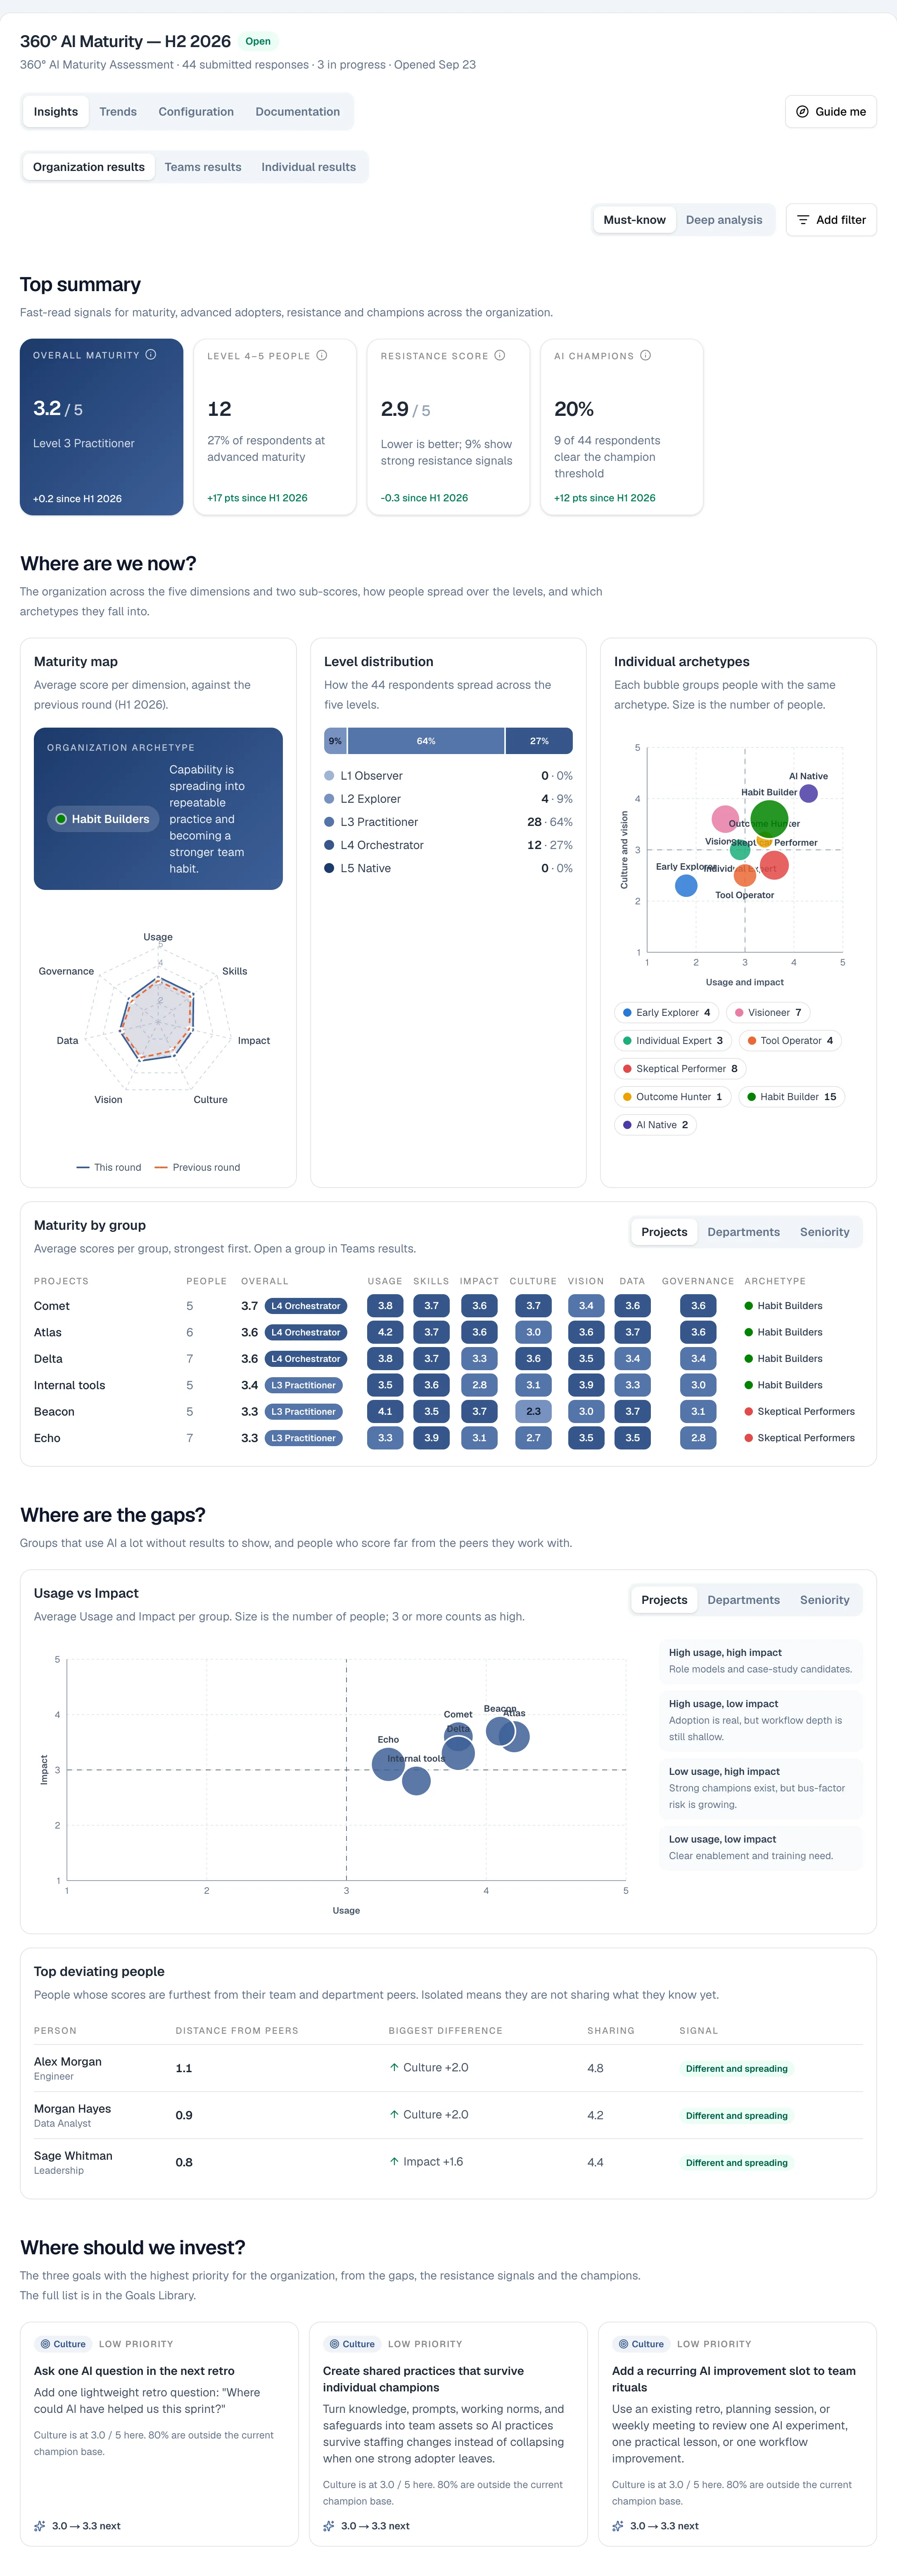
- Organization results: overall maturity and level, the share of people at L4–5, the resistance score and AI champions; the maturity map; how people spread over the levels and archetypes; and maturity by project, department or seniority.
- Teams results: any project, department or seniority group against the organization's average, with its missing archetypes, its champions and its members.
- Individual results: a person's map against the organization, their role and their project peers, their three biggest gaps, three next steps, and every answer with its points.
Trends sets a round against the one before: overall maturity, people at L4–5, resistance, champions and each dimension.
Usage against Impact
Using AI a lot isn't the same as getting results from it. The report places every group, or every person in a team, by Usage and Impact, with 3 as the line between low and high:
Deep analysis adds the gap cards: support asked for against current skills, where tool access holds people back, practices that rest on one person, impact without changed workflows, sensitive-data risks, and where vision isn't turning into action.
Signals beyond the score
A few figures read answers the score leaves out, or cross-check the ones it uses.
A check for careless answers. On the Delivery & Engineering questionnaire, one question lists project configuration files, three of which don't exist. Picking one flags the response in the report.
From results to goals
The Goals Library holds 46 goals, 25 for a person and 21 for a team, each tied to a dimension and to the levels it suits best. For each person, group and the organization, the report suggests the three with the highest priority:
- For a person, from how low the dimension is, how far it sits below the organization, the same role or the project peers, and the weakest answers behind it.
- For a group, from how low it is against the organization, how many members it affects, and what holds them back: resistance, tool access or unmet demand for support.
- Either way, goals that suit the current level rank higher: at L2, goals for L2 and L3.
Each comes with a near target, a few tenths above today's score, such as Culture 2.9 → 3.2 for a team. Here is what the library suggests at each level:
Who sees what
The 360° is about named people: the person and team views, and the comparison from one round to the next, need to know who answered. So by default, people sign in with Google on your company's domain.
- Whoever can open the report sees names and every answer. By default that's whoever launched it and your admins, plus anyone they share it with.
- A shared password works too. It asks each person for their email, typed rather than checked. You can make it anonymous instead: the answers still count, without names.
- People don't see their scores in the survey. Go through them in a one-to-one, not a ranking.
- Use it for development, not performance reviews. Ratings collected for decisions about people come out more lenient. More in Honest answers about AI.
Limits
- It's self-reported. People's ratings of their own skill track measured skill only loosely, so read a score as how someone sees their own practice. The check against the team and the check for careless answers catch some overstatement, not all of it.
- Small groups swing. In a team of four, one person moves the average a lot, so read small differences between small groups with care.
- Tool lists date quickly. The questions name current tools and models, so we add new ones as they ship. The points an answer is worth never change, so rounds stay comparable.