
The short version
The survey is the Artificial Intelligence Anxiety Scale (AIAS), a validated psychometric instrument developed by Wang and Wang: 21 statements about AI, each answered from 1, strongly disagree, to 7, strongly agree, in about five minutes. We kept the statements and their order, and gave the four research factors everyday names.
The report shows the average answer for each area and overall, how answers split between lower and higher concern, and what might help. It describes a group's expressed concern. It is not a clinical diagnosis, and there are no validated cut-offs for "low" or "high".
A validated scale
Most of our surveys are our own questions. This one isn't: it's a published, validated instrument, used as published. Wang and Wang developed the scale to measure "an individual's psychological fear, stress, and discomfort regarding the integration and evolution of artificial intelligence", and found a four-factor structure, which a 2025 German translation and validation confirmed with a confirmatory factor analysis.
- What we kept: all 21 statements, their wording and their order, all required; the 7-point agreement scale; and the four factors, scored in the same direction with no reverse-scored items.
- What we changed: the product calls it "AI Anxiety" and avoids clinical language; the four factors got everyday names on screen (the research names are kept where the method is explained); and the report adds its own reading aids, the concern signal and the AI Concern Index, which are ours, not part of the scale.
Four areas
The statements group into four areas, with their names in the research in brackets. Each statement describes a fear or worry, so agreeing means more expressed concern.
On screen the row shows seven numbers under three group labels, Disagree, Neutral, Agree; "Strongly disagree" and "Strongly agree" are read out to screen readers. Choosing an answer moves on to the next statement.
From answers to a signal
- Each statement scores its answer, 1 to 7. A response counts once all 21 are answered. The raw total runs from 21 to 147, but the report reads everything on the 1–7 scale: each person's overall mean, and a mean per area.
- Areas are compared on their means, never on raw totals, because they have different numbers of statements: 8, 6, 4 and 3.
- The group's figure is the mean of people's means. The highest area is the one with the highest mean.
- The AI Concern Index maps the overall mean to 0–100%: (mean − 1) ÷ 6 × 100, so 1 is 0%, neutral 4 is 50% and 7 is 100%. It's a product construct for trends, not part of the scale.
The report also puts the overall mean into words. These bands are ours, descriptive, not validated cut-offs:
Reading the numbers
The research is explicit that validated severity cut-offs don't exist, and that reference values differ a lot between populations. So the report never calls a score low, average or high anxiety, shows no red-amber-green severity, and compares a group only with itself: across its four areas in one run, and with its own earlier runs.
- Look at the split, not just the mean. The report counts every answer as lower concern (1–3), neutral (4) or higher concern (5–7). A mean of 4 can be a neutral group or a divided one.
- Use it for support and communication, not to assess individuals. Results describe this group of respondents.
What the report shows
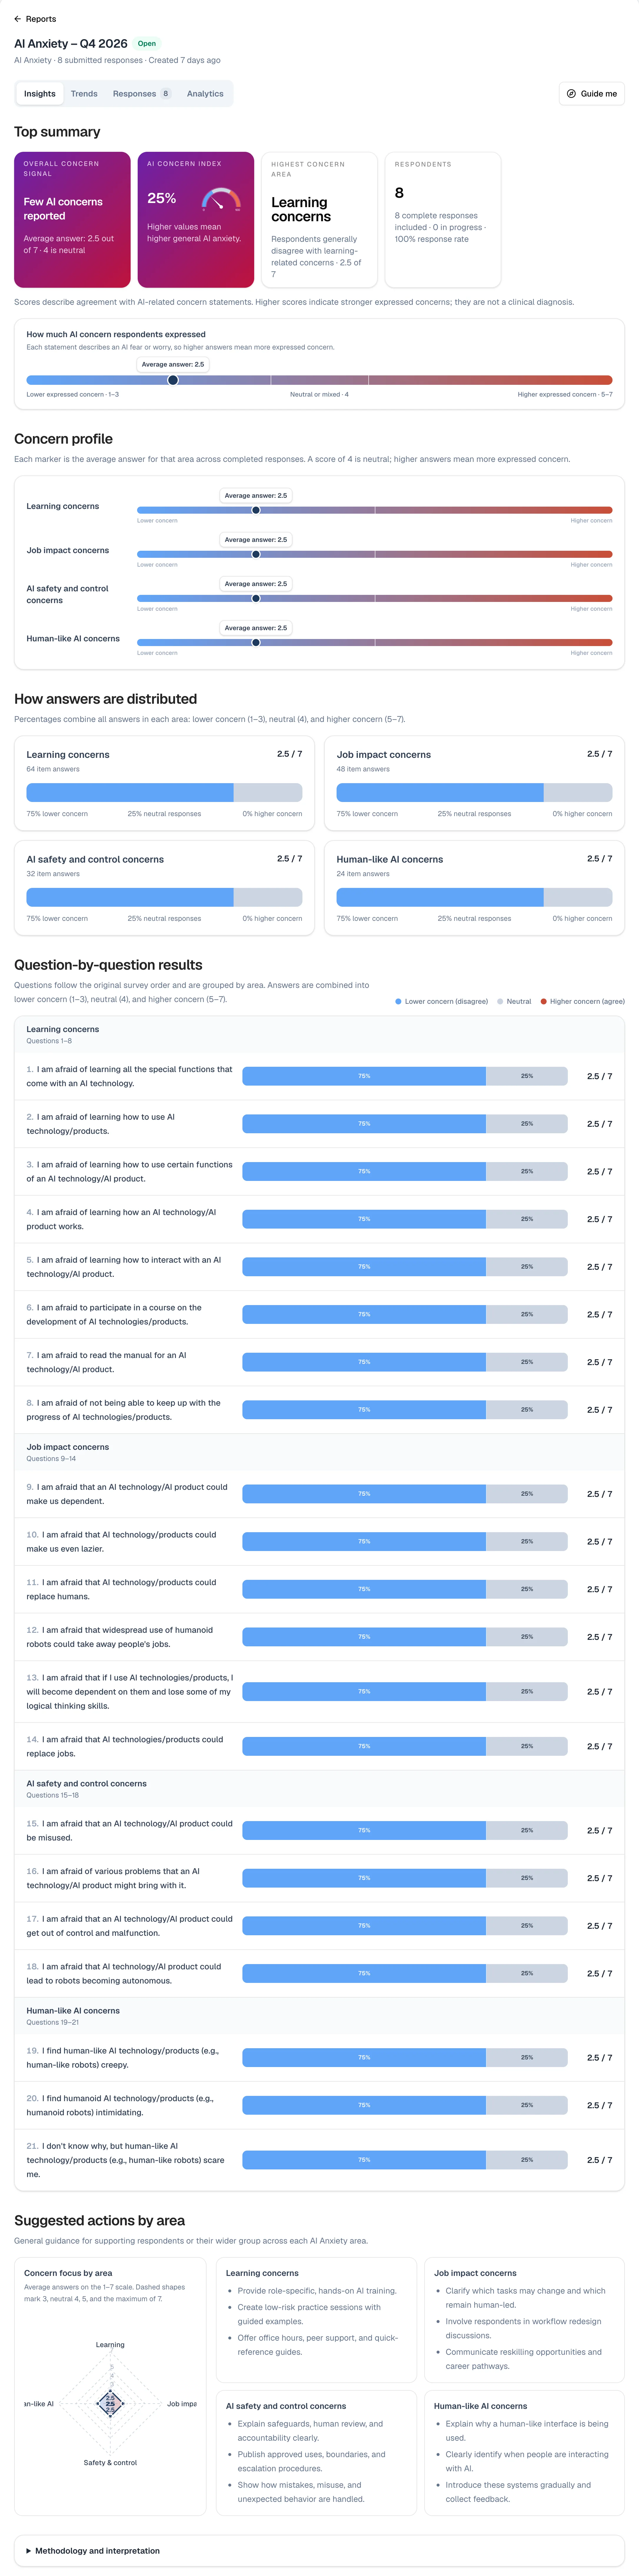
- Top summary: the overall concern signal with the average answer, the AI Concern Index, the highest concern area and the respondent count.
- Concern profile: the average answer for each area on the 1–7 scale, with 4 marked as neutral.
- How answers are distributed and question-by-question results, in the scale's order, each split into lower concern, neutral and higher concern.
- Suggested actions by area: general guidance for each area, the same for every run, for example for learning comfort: "Provide role-specific, hands-on AI training."
- Trends: the overall mean, the AI Concern Index and the four area means across runs of the survey, each run shown whatever its response count.
When to run it
Use it when you need to know how people feel about AI, not just whether they use it: before an AI rollout, to set a baseline; during adoption, to find concerns while piloting tools or training; and after a major change, to see how concerns shifted. Repeat it with the same audience at regular checkpoints. For the concrete obstacles in people's work, run AI Adoption Barriers alongside it.
Who sees what
- Anonymous by default. The one-click launch uses a shared password with no names, and advanced setup starts anonymous too; it can ask for a name or an email, or use Google sign-in, and then the Responses tab names people.
- Whoever can open the report sees every answer. A public link, if one is made, shows the Insights as aggregates. People don't see their own result.
Limits
- No benchmark. There are no universal cut-offs or population percentiles to compare with, and we don't add any.
- Descriptive, not diagnostic. The scale measures expressed concern; it can't say why, and the report makes no causal claims or mental-health advice.
- English only, for now. The statements are the scale's English items; a validated translation would be a separate instrument.
- Small groups swing. Results show from the first response, with no minimum group size.