
The short version
Every quarter we pick the AI developments that matter, 25 this quarter, and ask people how far they have got with each: from not aware, through heard of it, understand it and tried it, to occasional and regular use at work. Each person picks the Technical or Non-technical path and answers 18 questions, about 8 minutes.
Each development carries the stage the market was expected to be at this quarter. The report sets the group's median answer against it, so you see where you are ahead, on track or behind, and how far answers have got overall, from awareness to regular use. It's descriptive: not a skills test, an employee rating or an external benchmark.
This quarter's markers
A marker is one AI development: a practice or capability, not a product. Each belongs to one of five areas, and each has an audience: 11 are shared by everyone, 7 are for the Technical path, 7 for the Non-technical one, so both paths answer the same number. Every question starts with "Where are you currently with…", under a one-line market update that says why the development matters.
First, one question picks the path: "Which best describes your work?", Technical or Non-technical. The survey shows only the markers for that path, and the server refuses answers to the others.
Six stages
Every marker is answered on the same scale. The first six answers are an ordered path; the last two are outcomes outside it: choosing not to use something after evaluating it, or it not being relevant to the work, are not failed adoption.
Against the market
For each marker, the content owner approves one expected stage for the quarter: an internal, approved market-readiness expectation, not an industry percentile. The report compares it with the group's answers:
- The observed stage is the median of the comparable answers, the six ordered stages. An odd number of answers has one middle answer; an even number averages the two middle ones, so a median can sit between two stages, shown as "Understand–Tried".
- The gap is observed minus expected, in stages, and gives the position: Well ahead (1.5 stages or more ahead), Ahead (0.5 to 1.5 ahead), On track (within half a stage), Behind (0.5 to 1.5 behind), Well behind (1.5 or more behind).
- An area's position averages the gaps of its markers; the overall position is the median of the visible markers' gaps.
The absorption funnel
Besides the positions, the report counts how far answers have got. Each rate is a share of applicable answers, everything but "not relevant", across the visible markers, so rates count answers, not people:
A big drop between two steps shows where adoption stalls: lots of awareness and little trial means people have heard, but nothing lets them try.
What the report shows
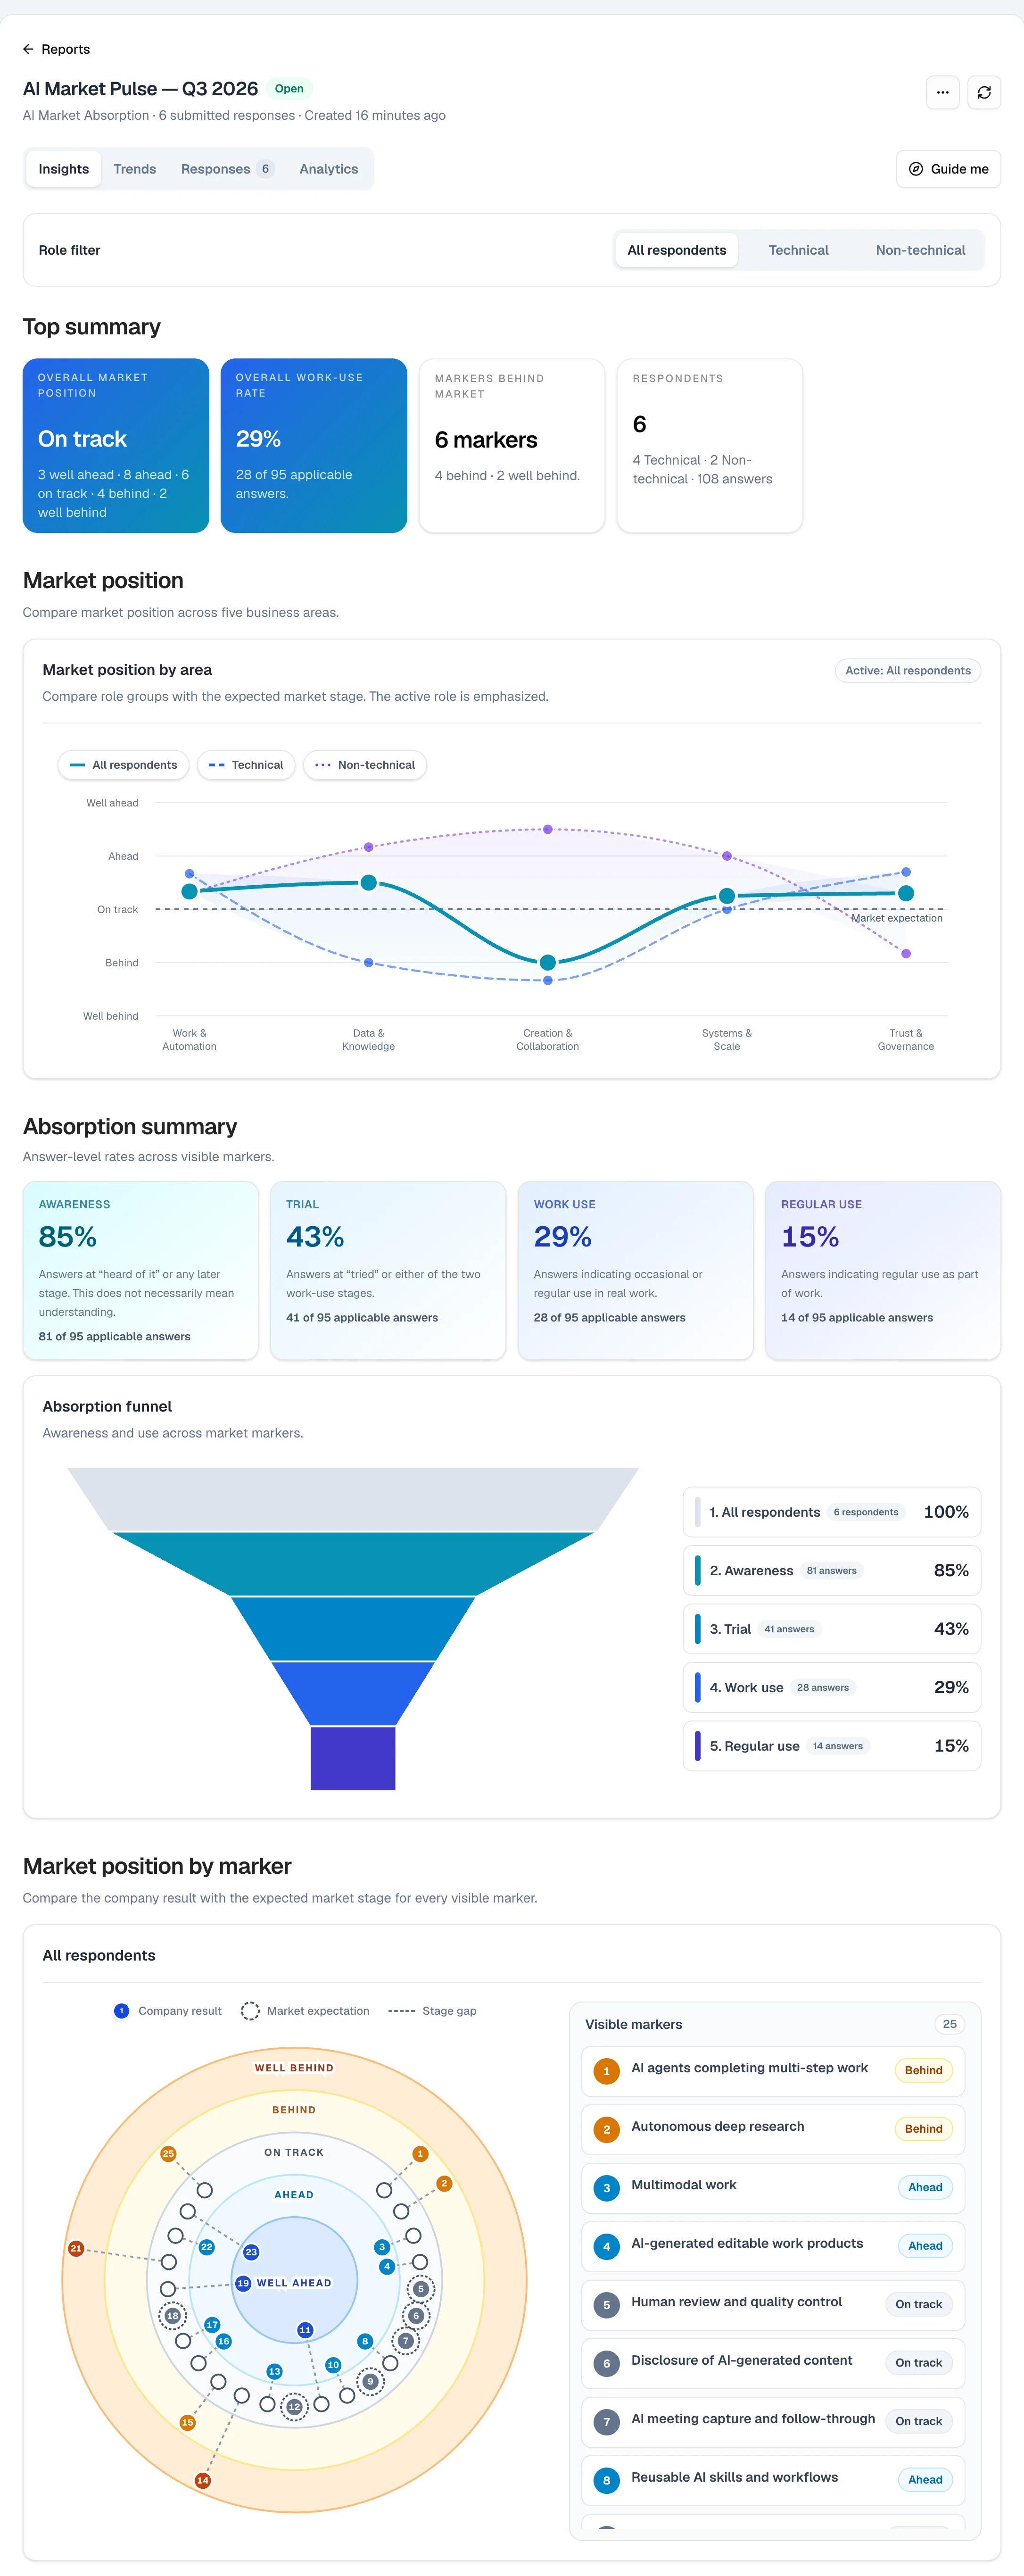
- Role filter: all respondents, Technical or Non-technical. The whole report follows it; in the All view, a path's own markers count only the people who saw them.
- Top summary: the overall market position with its breakdown ("2 ahead · 10 on track · 1 behind"), the work-use rate, how many markers are behind, and the respondents.
- Market position by area, each role group against the market expectation, and by marker, every development as a dot: closer to the centre is better, and the dashed circles show where the market is.
- Absorption summary and funnel, then question-by-question results: each marker's current and expected stage and how its answers spread across the scale.
- Suggested actions: close the biggest gap (the markers behind, well behind first, each with the action for its current stage), improve the weakest area, and scale what already works. They are fixed templates, not generated advice.
- Trends: the four rates quarter by quarter, for runs that used the same set of markers.
Every quarter
Each quarter is a new version of the survey with newly written markers, published after a review. Existing runs keep the version they were launched with. A marker continues from one quarter to the next only when the development and the answer's meaning stay the same, so trends never silently join a changed question to an old one. The current version is 2026 Q3.
Who sees what
- It can run anonymously, and the one-click launch does: a shared password with no names. Advanced setup can ask for a name or an email, and then the Responses tab shows them as self-reported.
- No ranking, no leaderboard. Whoever can open the report sees every response; a public link, if one is made, shows the Insights as aggregates.
Limits
- Self-reported. "Use regularly at work" is what people say, not verified expertise.
- The expectations are ours. They are approved internal targets per marker, the same for both paths, not industry data or competitor benchmarks.
- No index, no segments. There is no 0–100 score, no team or department view and no small-sample warning: a role group of three is three people's answers.
- Trends need the same markers. A changed, added or retired marker starts a new trend line.