

Seat counts miss part of the AI bill
Finance wants one number for next year's AI budget, and the quickest answer is seats times list price. It's tidy and easy to defend in a meeting, which is why most AI financial forecasting starts there. It's also only part of the bill.
A seat count tells you how many people could use a tool. It doesn't tell you how many will, how well, or what gets billed around them. FinOps Foundation working-group guidance, focused on cloud-based LLM workloads, recommends a quantity times rate approach across several functional domains instead of a single seat figure.
The same guidance asks whether cost will grow in a straight line with user adoption when a proof of concept moves into production. It poses that as a question to test, not a finding. It's the right question to ask before you multiply anything.
Seat-based forecasts get one thing right: they're simple and auditable. They fall short because they treat every licence as equal. We think a seat count is a ceiling on exposure, not a forecast of spend, so use it as one line and let adoption stage, skills gaps and barriers drive the rest.
One caveat on method: there's no published evidence we know of showing that stage, skills or barrier data improve forecast accuracy. Treat what follows as an editorial method, and test it against your own actuals.
Sources: How to Forecast AI Services Costs in Cloud
Pricing models that break the per-seat assumption
The FinOps overview from 2026 lists subscription or seat pricing as just one of several AI pricing models, next to usage-based, provisioned and tiered options. Each has its own forecasting risk. For seats, the risk it names is paying for licences nobody uses.
Prices also move. The FinOps paper on optimization says AI pricing has trended down while quality jumps every six to nine months, which affects how you project costs and how much a long commitment is worth.
And consumption isn't value. A FinOps cost estimation paper cautions that measuring tokens alone doesn't show the tasks performed or the value delivered. Your rate assumptions need room to move, and your volume assumptions need a link to real work.
Sources: FinOps for AI Overview, Effect of Optimization on AI Forecasting, Cost Estimation of AI Workloads
Costs around the licence add up

DX, a developer-productivity vendor, published an illustrative total-cost model (last updated June 2025). For a 100-developer team, it puts AI coding tool cost at $66,000 or more a year once training, overhead and shadow costs are included, against about $40,000 in direct licensing. It's one team size at 2025 prices, not a measured sample.
Milestone, a vendor selling AI spend-visibility tools, wrote in May 2026 that AI tool cost comes from licences, API usage, infrastructure and duplicated effort. Take both as vendor opinion. Both suggest the bill extends beyond the licence.
Our editorial advice is to give each layer its own line, so a change in one doesn't hide inside another.
- Licences and seats, priced only for people likely to use them
- Usage-based consumption such as API calls
- Enablement and training, sized from measured gaps
- Shared infrastructure and overhead
- A named experimentation reserve
Sources: Total cost of ownership of AI coding tools, How Engineering Leaders Should Think About AI Tool Budgets in 2026 | Milestone AI
What is budget forecasting once AI enters the plan?
Our plain definition: budget forecasting means estimating future spend from stated assumptions, then revising as actuals arrive. AI budget forecasting follows the same logic. AI financial forecasting differs mainly because the assumptions move faster, as the FinOps guidance below suggests.
The FinOps overview from 2026 says AI forecasts are less predictable than cloud forecasts. It recommends shorter windows, more frequent revisions and flexible pilot funding agreed with Finance. That's guidance from practitioners, not a tested accuracy result.
Finance teams are already in this seat. The State of FinOps 2026 reports that 98% of respondents now manage AI spend, up from 63% in 2025 and 31% in 2024, and that allocation, forecasting and budgeting rank among the top prioritized capabilities. It's a survey of the FinOps community, so it doesn't represent every organization.
So treat the forecast as a set of named assumptions you can revise, not a single number you have to defend.
Sources: FinOps for AI Overview, State of FinOps 2026 Report
Spend benchmarks are context, not targets
Benchmarks help you check whether a forecast is wildly off. They don't tell you what to spend. Most of the figures below describe developer tooling or cloud AI workloads, and every one comes from a different population.
Sources: Planning your 2026 AI tooling budget: guidance for engineering leaders, How Much Are Firms Spending on AI (and What Will Happen to Headcounts)? - Federal Reserve Bank of Atlanta, CIO Planning for 2027: How to Close the AI Ambition Gap
Market signals say little about your budget
According to Gartner's 2027 CIO and Technology Executive Survey, funding for agentic AI is expected to increase by an average of 31.8% in 2027, against 3.7% average IT budget growth. That's an average expectation, not actual spend.
The Atlanta Fed's Macroblog (May 2026) reported a March 2026 executive survey. US firms reported spending $1,358 per employee on AI in 2025 and planned higher spending in 2026, with a heavily skewed distribution.
The skew matters more than the average. In that survey, more than half of respondents expected to spend no more than $200 per employee in 2026, while the top 10 percent planned at least $2,800, a 14-fold gap. An average sits where almost nobody does.
Vendor sources add developer-only context, summarized below. Use them as sanity checks, never as a budget.
| Signal | Source and population | Caution |
|---|---|---|
| About $500 to $1,000 per developer per year as an entry point | DX podcast notes, 2026 planning discussion | Developer tooling only; poll and webinar audience |
| Around 1 to 8% of revenue on internal productivity tools | ICONIQ benchmark, reported second-hand by DX | Year and sample not stated; may skew by company type |
| $1,358 per employee in 2025, higher spend planned for 2026 | Atlanta Fed Macroblog, US firms, March 2026 survey | Executive-reported; heavily skewed |
Sources: How Much Are Firms Spending on AI (and What Will Happen to Headcounts)? - Federal Reserve Bank of Atlanta, CIO Planning for 2027: How to Close the AI Ambition Gap, Planning your 2026 AI tooling budget: guidance for engineering leaders
Perceptions run ahead of measured outcomes

McKinsey's 2026 global survey (August 2026) found that 80 percent of respondents say AI improved their individual productivity, while 37 percent attribute at least some EBIT impact to AI, essentially unchanged from last year. Both are respondents' own reports, not causal measurement.
The pattern repeats. The Atlanta Fed post said executives reported little impact so far on productivity or employment, yet expected productivity to rise 2.25 percent over three years, an expectation taken from an earlier study. Gallagher's February 2026 survey found 86% of businesses see employee productivity impact as positive, and those measuring ROI anticipate an average of 28 months for value to outweigh upfront costs.
Meanwhile Gartner's 2027 CIO survey reports 58% of CIOs under pressure to deliver AI cost savings, 51% expecting AI to raise total cost of ownership, and 13% reporting significant value from AI tools so far. That's the room a forecaster works in.
We'd be skeptical of any budget case whose growth rests on perceived productivity alone. Keep perceptions in their own column, beside measured usage and cost, and let the second column set the numbers.
Sources: The State of AI: Global Survey 2026 | McKinsey, How Much Are Firms Spending on AI (and What Will Happen to Headcounts)? - Federal Reserve Bank of Atlanta, 2026 AI Adoption and Risk Benchmarking | Gallagher, CIO Planning for 2027: How to Close the AI Ambition Gap
Turn adoption stage into a cost driver
Our reasoning, not a research finding: stage matters to cost because people at different stages tend to consume different things, with more support early, more usage later and more review once work depends on AI. A flat seat rate hides all of it.
Stage isn't a verdict, though. The Adobe-commissioned Incisiv study of 5,633 senior executives, a vendor-commissioned survey, says adoption stage alone can mislead, because organizations at the same deployment level differ in their foundations. It also found 58% stalled at piloting or deploying, and only 15 of every 100 proposed ideas reaching production.
The takeaway for budgeting: don't assume pilot costs scale in a straight line, which is the question the FinOps guidance raises. Use stage as one input and pair it with skills and barriers.
Sources: State of AI Readiness Report 2026 | Adobe, How to Forecast AI Services Costs in Cloud
Use a maturity frame to set scenarios
The Software Engineering Institute at Carnegie Mellon released its AI Adoption Maturity Model v1 in June 2026. It assigns maturity per dimension on five levels, from Exploratory AI to Future Ready AI, across eight dimensions.
The SEI says it built the model from interviews with more than two dozen executives, surveys of nearly one thousand practitioners and reviews of over one hundred maturity efforts. It also says adoption failures rarely stem from technology alone, citing mismatched expectations, data capability, user understanding, talent shortages and underestimated time. Several of those are costs.
FinOps applies a similar idea to spend itself: a crawl, walk, run approach where cost management changes with maturity, and pilots rely on manual tracking and frequently revised budgets. That's a cost-management maturity model, not a measure of employee adoption.
AI Adoption Score's 360° AI Maturity Assessment places every person, team and department on levels from L1 Observer to L5 Native across Usage, Skills, Impact, Culture and Vision. That gives you a stage to attach assumptions to. Attaching a cost to each level is your own estimate.
Here's an editorial example, clearly hypothetical. Imagine a 400-person company with 100 regular users, 200 casual users and 100 non-users today. You'd write down three scenarios, each stating how many people move up a stage and what that does to consumption and enablement.
- Hold: nobody moves up, so only price changes touch the budget
- Partial move: 40 casual users become regular users
- Broad move: 80 casual users become regular users, with matching enablement and support lines
Sources: AI Adoption Maturity: Improving How Organizations Integrate AI Solutions | CMU Software Engineering Institute, FinOps for AI Overview
Split users by depth of use
DX recommends segmenting users into power users, casual users and non-users, and piloting with 10 to 20 developers to improve per-seat value forecasting. It also suggests tracking daily, weekly and monthly usage tiers, while acknowledging that time savings and satisfaction are hard to measure. It's a vendor recommendation for developers, not a tested method.
Microsoft's Adoption Score page, updated in August 2026, defines AI adoption for licensed Copilot users as averaging at least three active days a week, or 12 of 28 days. It applies only to Microsoft 365 Copilot and measures frequency, not skills or barriers.
Don't assume your tiers will look like the best organizations'. DX's Abi Noda said that at the very top end, about 60 to 70% of developers use AI code assistants daily or weekly. That's a spoken remark about leading organizations, with the underlying data not shown. Our editorial treatment of each tier is below.
| Tier | Likely cost behavior | Forecast treatment |
|---|---|---|
| Non-users | Seat cost with little return | Price seats only if a removable barrier is fixed |
| Casual users | Seat cost, light consumption | Seat line plus a small consumption range |
| Power users | Heavier consumption and support | Separate consumption line, revisited quarterly |
Sources: Total cost of ownership of AI coding tools, Planning your 2026 AI tooling budget: guidance for engineering leaders, AI Adoption Category in Adoption Score - Microsoft 365 admin | Microsoft Learn
Price skills gaps and barriers as separate lines

A skills gap and a barrier aren't the same bill. Training closes a skills gap. A barrier such as missing access, unclear rules or no time may be something IT, leadership or a manager can remove, and the training budget won't touch it.
The evidence says expertise is a real constraint. In a 2026 pulse survey of 30+ senior finance and accounting leaders among Addison Group's clients, a staffing firm, lack of internal expertise (62%) outranked budget constraints (17%) as a barrier. It's a small, narrow, multi-select sample.
Gartner's August 2026 CIO report page says 51% of CIOs name the gap between AI skill requirements and available talent as their biggest obstacle.
Leader confidence is a poor guide. In a 2025 survey of 505 data and analytics leaders from Precisely and Drexel LeBow, 86% said they had the skills for AI, yet 41% named skills among their biggest obstacles. So ask people, by task, rather than assuming.
AI Adoption Barriers asks which of 18 barriers in six areas hold people back, names who can remove each one, and says whether the main gap is skills, conditions or motivation. That split tells you whether a line belongs under training, IT or management time.
AI Skills Distribution is a self-reported map of who can do what with AI, and who is willing to help colleagues. Those volunteers matter for the forecast: peer help is an enablement line you can plan and size separately from external courses.
| Input | Question to ask | Budget line it informs |
|---|---|---|
| Skills gap | Who can't yet do the task independently? | Enablement and training |
| Access barrier | Who lacks the tool or licence they need? | Seat line |
| Rules and data barrier | What's blocked by policy or data access? | IT and governance time |
| Time and habits barrier | Who has no room in the week to learn? | Manager time, not course fees |
| Willing teachers | Who could help colleagues? | Peer enablement |
Sources: https://addisongroup.com/wp-content/uploads/2026/07/AI_Automation-Survey-6.23_Infographicv5.pdf, Top CIO Challenges & Priorities for H2 2026 | Gartner, https://www.lebow.drexel.edu/sites/default/files/2026-01/lebow-precisely-state-data-integrity-ai-readiness-2026.pdf
Build the forecast layer by layer
Here's the build, in the order we'd do it. Each layer gets its own quantity, rate and owner, and each scenario changes the quantities rather than the rates.
The FinOps paper on optimization says choices such as model selection, backend infrastructure and consumer-side optimizations can prevent significant forecasting errors and budget overruns. So fix the cheap levers first, then forecast what's left.
Sources: How to Forecast AI Services Costs in Cloud, Effect of Optimization on AI Forecasting
Step through quantity times rate
The quantity times rate approach from the FinOps working group is the spine. Quantity comes from your stage, tier and gap data. Rate comes from vendor pricing, with a range for movement.
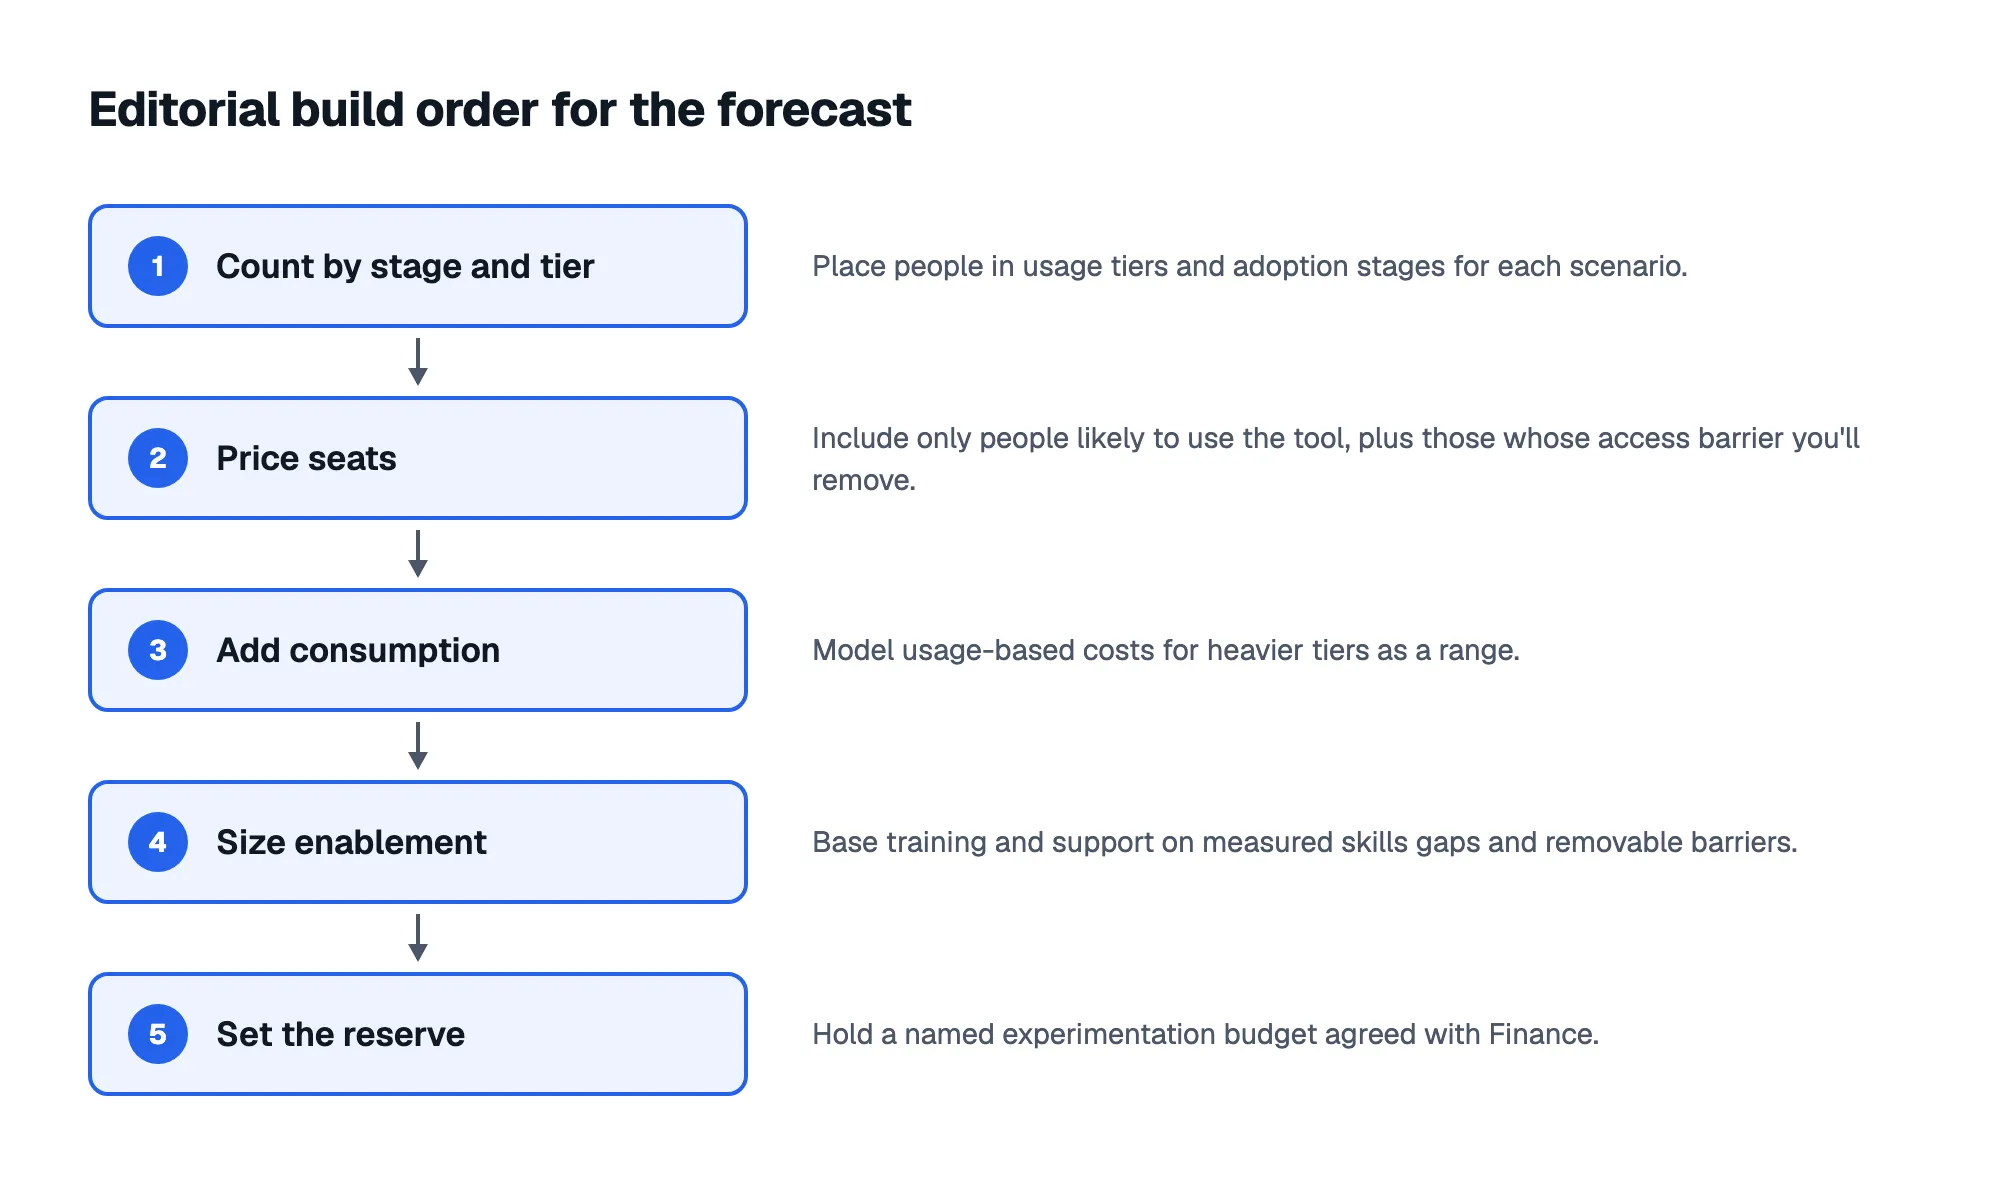
Take the hypothetical 400-person company, with illustrative rates invented for the arithmetic, not benchmarks. A seat costs $360 a year; a regular user adds $240 of consumption, a casual user $60. Enablement is $150 per person whose removable barrier you fix or who moves up a tier.
Base case: 100 regular, 200 casual and 100 non-users, 50 of them with a removable barrier, so seats cover 350 people. The partial move shifts 40 casual users to regular, the broad move 80. Only quantities change, so the hypothetical range runs from $179,500 to $205,900 before you widen it for price movement. Show Finance that range.
| Layer | Base case | Partial move | Broad move |
|---|---|---|---|
| Seats (350 × $360) | $126,000 | $126,000 | $126,000 |
| Consumption | $36,000 | $43,200 | $50,400 |
| Enablement | $7,500 (50 × $150) | $13,500 (90 × $150) | $19,500 (130 × $150) |
| Experimentation reserve | $10,000 | $10,000 | $10,000 |
| Total | $179,500 | $192,700 | $205,900 |
Finish with a reserve. Milestone's vendor blog recommends a baseline platform allocation plus a controlled experimentation budget with usage-tied reviews, and the FinOps overview recommends flexible pilot funding agreed with Finance. Name the reserve and say what it's for.
Sources: How to Forecast AI Services Costs in Cloud, How Engineering Leaders Should Think About AI Tool Budgets in 2026 | Milestone AI, FinOps for AI Overview
Forecast in ranges and revise often

Because AI forecasts are less predictable than cloud ones, the FinOps overview recommends shorter windows and more frequent revisions. We'd revise quarterly and keep a short log of the assumptions behind every scenario.
For use cases with a clear output, the same overview suggests tracking cost per successful outcome and reporting it as a range, since AI costs vary run to run. That's guidance, not validated for employee-adoption forecasting. It still beats a single point estimate.
Be careful with long commitments when prices fall and quality jumps every six to nine months, as the FinOps paper observes. At the pilot stage, FinOps expects manual tracking and frequently revised budgets. Accept that as the price of learning.
Sources: FinOps for AI Overview, Effect of Optimization on AI Forecasting
Name an owner and start with cheaper defaults
Gartner's 2027 CIO survey found that 73% of enterprises have no plans to develop rules for ownership of technology costs and solutions, even as 15.3% of technology solutions are developed outside central IT. Every forecast line needs someone who can explain a variance; that's our advice.
The Adobe/Incisiv study, which is vendor-commissioned, reports that leaders are 4.7 times more likely to have a formal owner with budget authority; leaders are 6% of respondents. Milestone's vendor blog suggests a mixed model: the platform team owns shared infrastructure, engineering leadership owns team tooling and finance sets guardrails.
We'd start every routine task on the cheapest tool that clears the quality bar, and make people justify the costlier one. Gartner recommends that CIOs require business value within 90 days and eliminate "zombie AI" projects. That's analyst advice, not tested evidence.
Token costs deserve a line of their own. McKinsey's August 2026 survey found that some respondents say AI operating costs, including tokens, constrained their AI use. As editorial advice, set allowances by role and task, and review output beside spend, because token counts alone don't show work done.
Sources: CIO Planning for 2027: How to Close the AI Ambition Gap, State of AI Readiness Report 2026 | Adobe, How Engineering Leaders Should Think About AI Tool Budgets in 2026 | Milestone AI, Effect of Optimization on AI Forecasting, The State of AI: Global Survey 2026 | McKinsey, Cost Estimation of AI Workloads
Measure now so next year's forecast improves
The Adobe/Incisiv study, a vendor-commissioned survey, recommends defining the outcome, baseline and attribution method before a program goes live. In the 2025 survey of 505 data and analytics leaders by Precisely and Drexel LeBow, 71% reported AI aligned with business goals, but only 31% had metrics tied to KPIs.
McKinsey found that high performers, about 6 percent of respondents, are twice as likely to say their organizations have defined processes to measure AI initiatives.
Surveys and telemetry answer different questions. AI Adoption Score's own homepage puts it this way: surveys ask what people say, and telemetry measures what they do. AI Adoption Score doesn't connect to your tools, so pair its results with the spend and usage data you already hold.
Every survey can be run again. After each intervention, rerun the relevant survey, see which stage, skills or barrier inputs moved, and update next quarter's assumptions.
Sources: State of AI Readiness Report 2026 | Adobe, https://www.lebow.drexel.edu/sites/default/files/2026-01/lebow-precisely-state-data-integrity-ai-readiness-2026.pdf, The State of AI: Global Survey 2026 | McKinsey, AI Adoption Score
Replace the seat count with a range you can defend
Seat counts tell you what you've bought. For AI financial forecasting, adoption stage, skills gaps and barriers tell you what you're likely to need. Build the forecast from quantity times rate across cost layers, keep perceptions apart from measured data, and give every line an owner.
Start this quarter: set baselines, write down three scenarios, and put your first range in front of Finance.
Sources: How to Forecast AI Services Costs in Cloud, FinOps for AI Overview
Frequently asked questions
Do we need survey responses from every employee?
No. Start with one or two teams where spend is highest or uncertainty is greatest, and read the results as scenario inputs, not a census. Add teams as you learn which questions change a budget line. Small samples are noisy, so treat early figures as ranges and widen them accordingly.
Should time spent learning count as a cost?
Track it, but keep it out of the cash budget. Hours spent learning are real, yet they don't appear on an invoice, so mixing them with licences blurs your variance reviews. Record an estimate as a memo line beside enablement, and revisit it when you rerun skills surveys to see who has moved up.
Does this method work outside engineering?
Yes, but lean on your own quantities. The published spend figures here mostly describe developer tooling, so they transfer poorly to sales, support or operations. Count people by stage and tier within each function, price each function's tools separately, and compare them only after checking what each team counts as AI spend.
How do you explain a forecast range to a CFO?
Lead with the drivers, not the spread. Show the three scenarios, how many people each assumes will move up a tier, and what evidence would tell you which scenario is unfolding. A range with named triggers reads as a plan; a range without them reads as hedging.