

The problem: why hard AI ROI numbers are often unavailable
Most organizations trying to size AI ROI hit the same wall: they cannot cleanly isolate AI's financial contribution from everything else happening in the business. Revenue, headcount, and process changes all move at once, so a controlled before-and-after comparison is rare outside a formal experiment.
This gap shows up at the top of companies too. PwC's 2026 Global CEO Survey of thousands of CEOs found sharp variation in how much financial return companies have realized from AI investment so far. Here is how PwC's Global Chairman described that divide:
“A small group of companies are already turning AI into measurable financial returns, while many others are still struggling to move beyond pilots.”
— Mohamed Kande, PwC Global Chairman · Source: PwC 2026 Global CEO Survey | PwC
Without audited financial data, many Heads of AI turn to what they already have: employee surveys about usage, confidence, and perceived impact. That data is faster to collect and easier to repeat than a full financial study, but it answers a different question than AI ROI in the strict financial sense.
What employee-reported data can tell you — and what it can't
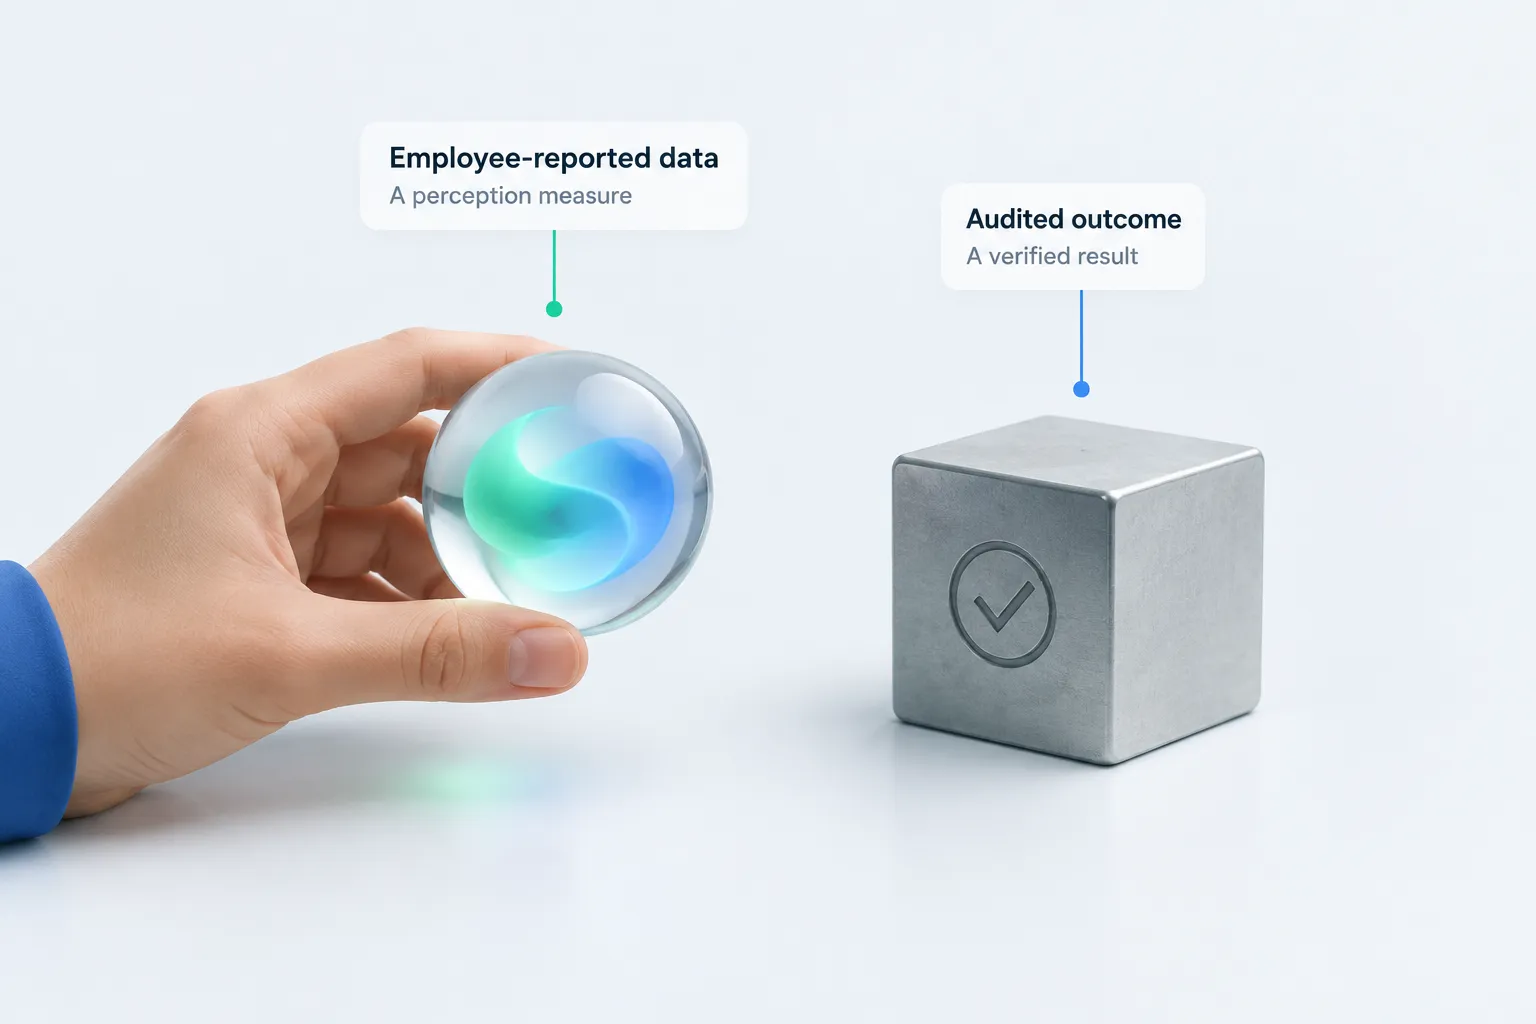
Employee-reported data is a perception measure, not an audited outcome. Employees can describe what they used, how often, and how much time or value they believe AI saved them — useful signals about adoption and sentiment, but not proof of company-wide financial return.
- Usage frequency and patterns across tools and tasks
- Perceived time saved or value from AI-assisted work
- Self-reported confidence and skill gaps
- Sentiment about barriers, training and support
How to read these results: treat self-reported figures in this guide as perceptions worth tracking, not causal measurements of AI ROI.
In a 2026 study of technical workers, METR found that an earlier self-reported estimate had overstated AI's effect on task time by an average of 40 percentage points compared with what was actually observed.
Employee-reported figures should inform decisions, not stand in as a financial ROI number; the triangulation section below explains what independent evidence to add alongside them.
Sources: Measuring the Self-Reported Impact of Early-2026 AI on Technical Worker Productivity - METR
Practical signals to collect from employees: usage, perceived time saved, manager support, barriers
Four signal types give a reasonably complete picture of adoption without requiring financial data upfront.
| Signal | Example question (suggested) | Why it matters |
|---|---|---|
| Usage frequency | How often do you use AI tools for work tasks in a typical week? | Distinguishes light trial from routine use |
| Perceived time saved or value | About how much time do you feel AI saves you in a typical week? | Surfaces where perceived value is concentrated |
| Manager support | Does your manager encourage or make time for you to use AI tools? | Included to explore whether manager encouragement relates to differences in perceived gains across teams |
| Barriers to adoption | What most limits your use of AI at work: relevance, training, trust, or something else? | Points to where training or governance fixes may help |
These are suggested question categories, not a validated survey instrument. Wording and scoring should be adapted to your organization and kept consistent over time so results track direction rather than an absolute score.
Sources: Global Indicator: Artificial Intelligence - Gallup, AI adoption and the productivity promise: what workers report
How self-reported signals compare across recent surveys
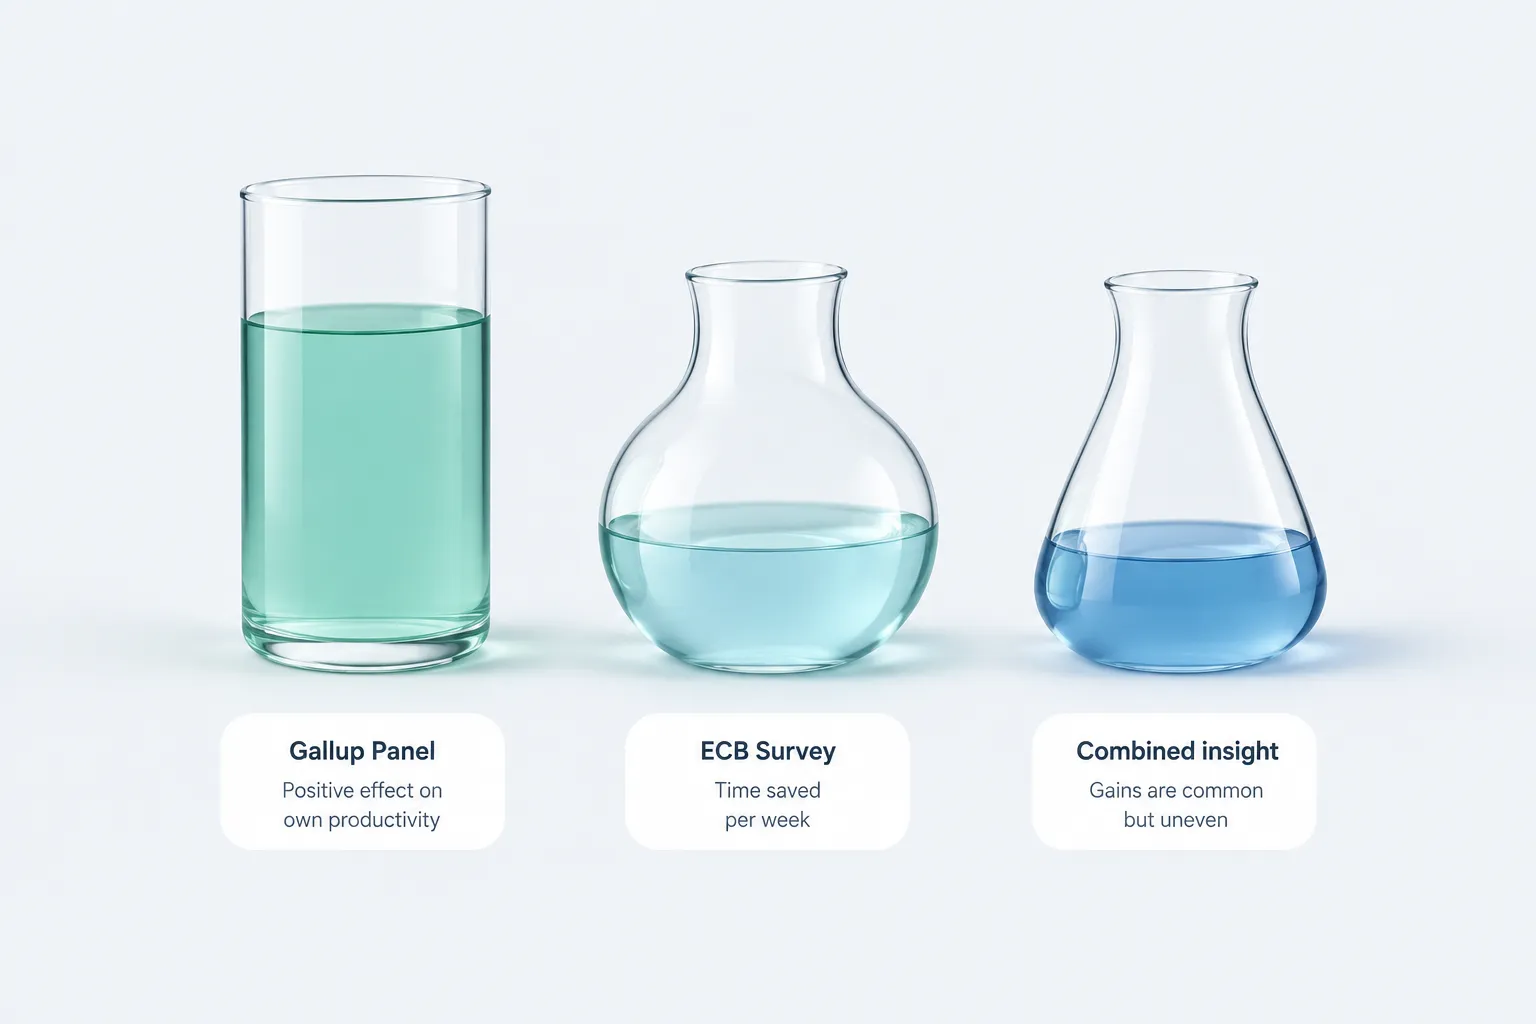
Three recent surveys illustrate both the promise and the noise in employee-reported AI data.
According to Gallup's Panel survey covering May 2026, 65% of employees at organizations that have implemented AI reported a positive effect on their own productivity.
Separately, the European Central Bank's Consumer Expectations Survey, covering roughly 20,000 workers across 11 euro-area countries as of August 2026, examined how much time AI users believe they save each week. As the ECB economists behind that analysis wrote:
“the median user reports saving three hours per week, or about 7.7% of median working time”
— António Dias da Silva, Laura Lebastard and David Sondermann, Economists in the ECB's Economics, Supply Side, Labour and Surveillance division (Principal Economist, Economist, and Deputy Head of Division respectively) · Source: AI adoption and the productivity promise: what workers report
Read together, these figures show self-reported gains are common but uneven across organizations and surveys.
| Survey | Population | Reported signal | Caveat |
|---|---|---|---|
| Gallup Panel, May 2026 | U.S. employees at AI-adopting organizations | 65% report a positive productivity effect | Self-reported perception, not measured output |
| ECB Consumer Expectations Survey, August 2026 | ~20,000 workers across 11 euro-area countries | Median 7.7% of working time saved | Highly skewed distribution; time saved not confirmed as extra output |
| METR survey, 2026 | 349 technical workers, convenience sample | Largest gap between reported and observed effect in earlier study | Non-representative, mostly paid participants; may not generalize |
Sources: Measuring the Self-Reported Impact of Early-2026 AI on Technical Worker Productivity - METR, Global Indicator: Artificial Intelligence - Gallup, AI adoption and the productivity promise: what workers report
Guardrails: known biases and limits of self-report data
Beyond the perception-versus-causal-evidence gap already noted, self-reported survey data carries a well-documented behavioral bias.
Social-desirability bias describes the general tendency of survey respondents to answer in ways they expect will be viewed favorably, a pattern documented across decades of behavioral research rather than something specific to AI surveys.
Applied to AI adoption surveys, this suggests some employees may round up their own enthusiasm or effectiveness, especially where leadership visibly champions AI. It is a reason to treat unusually high self-reports with caution rather than at face value.
Sources: Social-desirability bias - Wikipedia
A practical approach: triangulating employee data with other evidence
Employee-reported data becomes more useful when combined with other evidence rather than read alone.
Triangulating employee AI signals with other evidence
- Pair usage with perceived value: Compare how often people use AI with how much value they say it delivers.
- Add manager support context: Ask about manager encouragement to help explain differences in perceived impact across teams.
- Layer in barriers: Survey relevance, training and trust issues alongside impact questions.
- Repeat on a fixed cadence: Reuse identical wording each period to track direction rather than a single snapshot.
- Follow up on outliers: Check unusually high self-reported gains against qualitative evidence or visible outputs.
- Cross-check with operational data: Keep any available output or financial metrics as a separate, independent comparison.
Sources: Measuring the Self-Reported Impact of Early-2026 AI on Technical Worker Productivity - METR
Actionable conclusion: what to do this quarter
Heads of AI do not need audited financial statements to start making evidence-informed decisions about AI investment this quarter.
The steps below turn the signals discussed above into a starting checklist.
Frequently asked questions
Who should own the employee AI survey used for ROI signals?
Ownership varies, but Heads of AI, People teams or L&D often coordinate it since they need the results to prioritize training, tooling or governance decisions. Whoever owns it should keep question wording stable across rounds so results remain comparable.
How often should we repeat the survey?
A quarterly cadence is a reasonable starting point for most organizations, since it is frequent enough to catch meaningful shifts in adoption while giving interventions time to show up in employee responses before the next round.
Can employee-reported data ever fully replace financial AI ROI measurement?
No. Employee data reflects perception, not audited output or revenue, so it works best as one input alongside operational or financial metrics rather than a standalone substitute.
Should we survey every employee or just AI users?
Surveying both is useful: AI users can report usage and perceived value, while non-users can reveal barriers such as irrelevance or lack of training that suppress adoption across the wider workforce.
Sources: Measuring the Self-Reported Impact of Early-2026 AI on Technical Worker Productivity - METR