

Three stages of AI maturity, three different scorecards

When a board asks whether your company is "actually using AI," one dashboard number rarely answers what they're really asking. Are people ready, are they using it, and is it working are three different questions. Answering them well means separating the three stages of AI maturity: readiness, adoption, and impact.
Most leaders reach for a single figure instead: an overall "AI maturity score," an adoption percentage, or a productivity headline from a vendor deck. That's useful for a slide, and it does tell you something moved. It just can't tell you what moved, or whether it's the thing that matters.
The fix isn't a better single number. It's treating these three stages of AI maturity as three separate instruments, each with its own must-measure list and its own set of numbers to ignore. The table below is the short version; the rest of this guide is the long one.
| Stage | Core question | Example signal | Where the signal comes from |
|---|---|---|---|
| Readiness | Can we operationalize AI at all? | A named governance owner and reviewed workflows | Leadership interviews and policy review |
| Adoption | Are people actually changing how they work? | Tasks delegated to AI and frequency of use | Usage logs and employee surveys |
| Impact | Did it change a business outcome? | Cost, cycle time, or output change paired with labeled perception | Business metrics plus perception surveys |
AI readiness: what to check before you scale
AI readiness measurement asks a narrower question than adoption does: can your organization actually operationalize AI, not whether anyone has tried it yet. That's a leadership and infrastructure question, and it belongs to a small group of people, not the whole workforce.
That accountability question sits at the top: confirm who owns AI governance decisions, whether any workflows have been reviewed as real candidates for redesign, and whether data access and security controls exist. Alexander Sukharevsky, senior partner and global co-leader of QuantumBlack, AI by McKinsey, put it this way in commentary tied to McKinsey's March 2025 State of AI report:
“The more we see organizations using AI, the more we recognize that it takes a topdown process to really move the needle.”
— Alexander Sukharevsky, Senior partner and global coleader of QuantumBlack, AI by McKinsey · Source: https://www.mckinsey.com/~/media/mckinsey/business%20functions/quantumblack/our%20insights/the%20state%20of%20ai/2025/the-state-of-ai-how-organizations-are-rewiring-to-capture-value_final.pdf
That's the case for treating readiness as a leadership problem before it's a rollout problem: without an owner and a mandate, the rest of the measurement plan has nothing to attach to.
Readiness signals worth tracking
Look for signals that show operational capability, not enthusiasm. A named governance owner, a documented review of which workflows are realistic AI candidates, and confirmed data access controls all tell you the organization can act, not just talk.
A quick baseline read helps too. AI Adoption Score's Quick AI Self-Evaluation is built as a fast, ten-question self-check compared against the current market, meant as an entry point before a deeper assessment rather than a verdict on its own.
Readiness metrics that mislead
License counts, training sign-up numbers, and a single pilot's launch announcement all feel like readiness evidence. None of them show whether the organization can actually operationalize AI: a purchased license says nothing about governance, and a sign-up says nothing about completion.
Treat these as activity, not readiness. If you can't name who owns AI governance or point to a reviewed workflow, the organization isn't ready yet, no matter how many people clicked "register."
AI adoption: where activity turns into real use

Once rollout is done, the question changes from can we to are we. This is where AI adoption metrics either earn their keep or get abused, because the easiest numbers to pull from a system are rarely the ones that show real behavior change.
Most dashboards default to login counts and time spent in the tool. Those numbers are easy to report, and a total collapse in either one is a real warning sign. But a rising number doesn't tell you what people actually did with that time.
BCG's own research, based on its work with dozens of companies as of March 2026, found that most organizations stay preoccupied with these input metrics, logins and time-on-tool, as their stand-in for adoption progress.
BCG's adoption model names a later, more telling stage instead: delegation, where employees hand off well-defined tasks, such as drafting emails or compiling reports, to AI rather than just experimenting with it.
Sources: AI Adoption Puzzle: Why Usage Is Up But Impact Is Not | BCG, AI Adoption Puzzle: Why Usage Is Up But Impact Is Not | BCG
Adoption metrics worth tracking
Track depth and behavior change instead of raw activity: which tasks get delegated, how consistently AI gets used, whether a workflow was actually rebuilt, and how usage differs by role rather than one blended company figure.
| Dimension | What it captures | Example signal | Typical source |
|---|---|---|---|
| Task delegation | Whether well-defined tasks are handed to AI rather than just tried once | Drafting emails or compiling reports assigned to AI as a default step | Workflow review or employee survey |
| Usage frequency and consistency | Whether use has become a habit rather than a one-off | Usage-log frequency measured as a daily-habit pattern, the approach behind Microsoft's Copilot Adoption Score | Tool usage logs, vendor-specific |
| Workflow redesign | Whether a process was actually rebuilt around AI, not just AI bolted on | A step removed or reordered because AI now handles it | Process documentation, manager interviews |
| Role and persona mix | Whether champions, cautious users, and skeptics differ in behavior | Adoption broken out by role or persona rather than one company figure | Segmented survey data |
Segment adoption data by role rather than reporting one company-wide number: champions, cautious users, and skeptics likely face different barriers, so a blended figure can hide where training or support should go next. AI Adoption Score's Team AI Archetype Balance is built to identify these archetypes across a team so leaders can build a more balanced mix rather than assuming everyone adopts the same way.
Training allocation benefits from the same precision: match programs to each person's actual skill gap rather than rolling out the same course to everyone regardless of where they already stand.
Sources: AI Adoption Puzzle: Why Usage Is Up But Impact Is Not | BCG, AI Adoption Category in Adoption Score - Microsoft 365 admin | Microsoft Learn
Adoption vanity metrics to avoid
Login counts and time-in-tool sit at the top of the list, for the reason BCG's research already flagged: they measure exposure, not behavior change. Seat or license utilization percentage has the same problem, since it says nothing about what work actually got done.
A single company-wide adoption rate belongs on this list too; it flattens the gap between a team already delegating real tasks and one that logged in once. Even vendors that do track usage logs warn against chasing a perfect number: Microsoft's own guidance for its Copilot Adoption Score treats 80 to 90 points per category as typical for a mature organization, not full marks.
Sources: AI Adoption Puzzle: Why Usage Is Up But Impact Is Not | BCG, Microsoft Adoption Score Report Overview - Microsoft 365 admin | Microsoft Learn
AI impact: what changed, not what people felt

Adoption tells you people are using AI. Impact asks a harder question: did it change a cost, a cycle time, or a result anyone outside the team would notice. This is where AI impact measurement business cases either hold up or fall apart.
The numbers leaders reach for here are usually self-reported. McKinsey's 2026 Global Survey, published in August 2026, found that 80 percent of respondents reported AI had improved their individual productivity.
The same survey found 37 percent of respondents attributed at least some EBIT impact to AI use.
Both figures are self-reported perceptions from survey respondents, not independently measured outcomes; useful for gauging sentiment, not for proving a return on investment on their own.
Sources: The State of AI: Global Survey 2026 | McKinsey
Self-reported impact isn't measured impact
The gap between feeling and fact shows up even within the same body of research. Gallup's February 2026 U.S. panel survey found that only about one in 10 employees at AI-adopting organizations strongly agreed AI had transformed how work actually gets done there.
Researchers who run these surveys say the same thing about the instrument itself. METR's May 2026 methodology notes, drawn from a convenience sample of 349 mostly technical workers, caution that respondents struggle to answer quantitative impact questions accurately.
Vendor-suggested survey wording shows what this self-report actually looks like in practice: Microsoft suggests employees rate agreement with statements like "When I use Copilot, I'm more productive," an opinion, not a measured output change.
The clearest evidence of the gap comes from METR's July 2025 controlled trial: 16 experienced open-source developers completed 246 tasks in mature codebases they knew well, letting the study isolate AI's actual effect from confounds like task difficulty.
Even after AI measurably slowed these developers down, they still believed it had sped them up by 20 percent. That single result is worth sitting with: belief and measured outcome pointed in opposite directions for people with real expertise in the task.
| Question asked | Self-reported example | What it actually shows | Pair it with |
|---|---|---|---|
| Did AI make you more productive? | 80 percent of respondents told McKinsey's 2026 Global Survey that AI improved their individual productivity | A personal impression, not a measured output change | Time-on-task or output data for the same work |
| Did AI change how work gets done? | Only about one in 10 employees at AI-adopting organizations strongly agreed AI had transformed their work, per Gallup's February 2026 survey | A belief that can diverge sharply from reported productivity gains | A process or workflow audit |
| Did AI speed you up? | In METR's July 2025 controlled trial, developers still believed AI had sped them up by 20 percent after actually being slowed down | A belief that can be wrong even when the real effect is measured directly | A controlled or before-and-after comparison |
Sources: Rising AI Adoption Spurs Workforce Changes, Measuring the Self-Reported Impact of Early-2026 AI on Technical Worker Productivity - METR, AI Adoption Category in Adoption Score - Microsoft 365 admin | Microsoft Learn, Measuring the Impact of Early-2025 AI on Experienced Open-Source Developer Productivity - METR, https://metr.org/Early_2025_AI_Experienced_OS_Devs_Study-paper.pdf
Impact metrics worth tracking
Track business outcomes directly wherever you can: cost, cycle time, error rate, or output, measured before and after adoption. Keep perception data too, but label it as perception in every report you hand to a board.
A structured employee survey is one practical way to capture that labeled perception data consistently, provided every report is explicit that perceived impact is self-reported, not measured causal productivity.
Don't let a self-reported multiplier stand in for ROI. "Employees say they're twice as productive" is a real finding worth reporting, but it's not a substitute for a before-and-after number on the outcome you actually care about.
Turn the three stages into a measurement cadence

None of these three stages is a one-time check. Usage patterns shift as tools and training change, and perceptions shift with them, so re-run readiness and adoption measurement on a regular cadence, a quarterly rhythm works for most organizations, rather than treating either as a launch-day event.
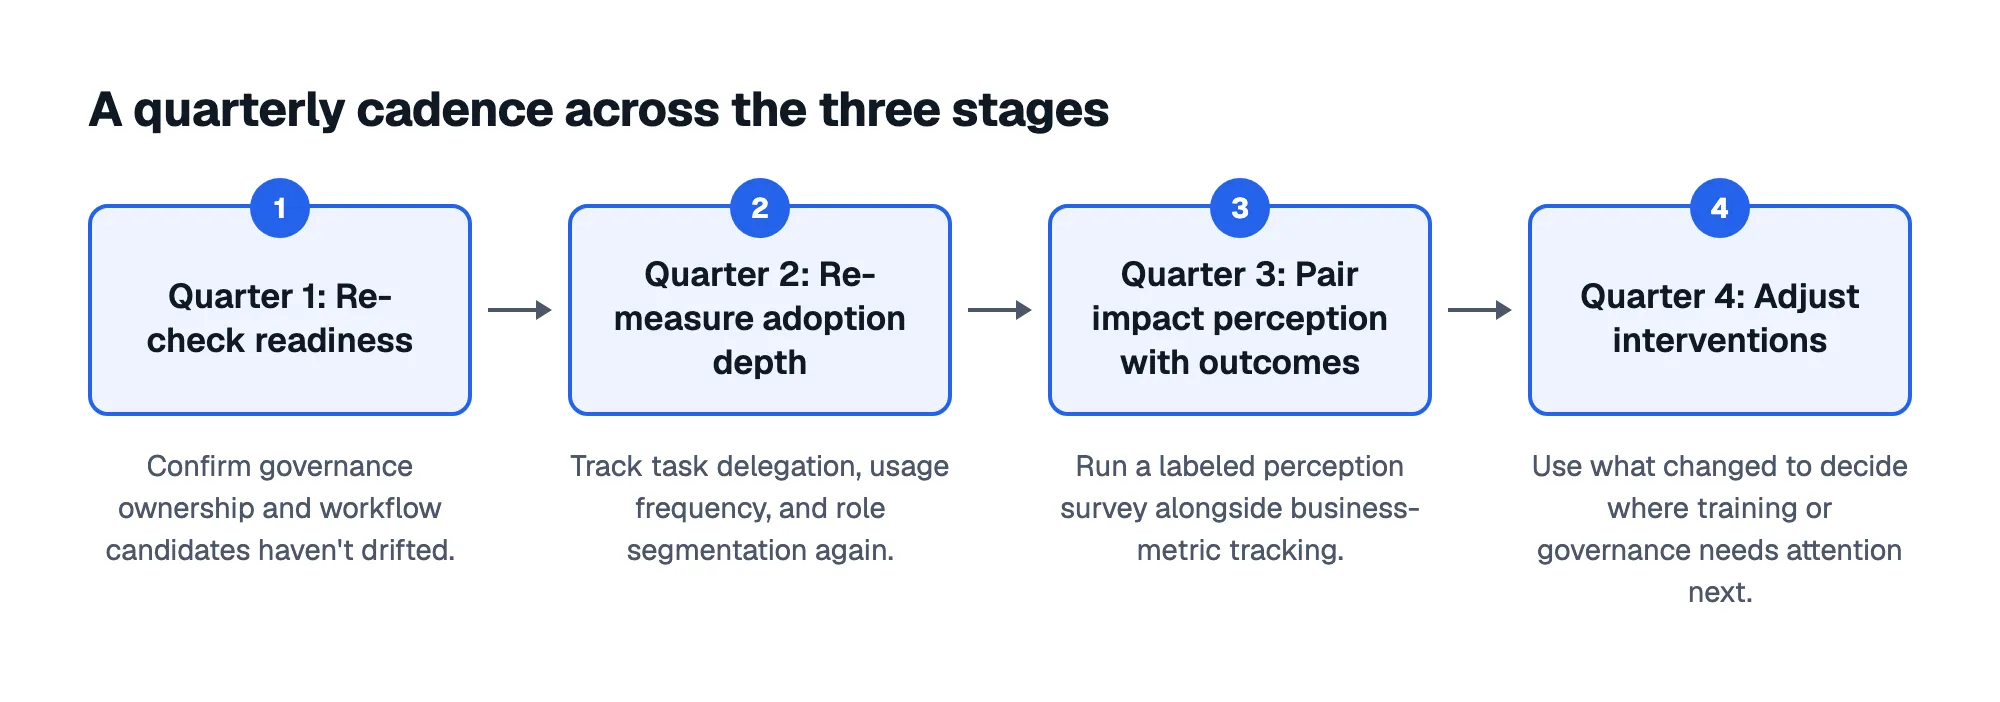
A quarterly cadence across the three stages
- Quarter 1: Re-check readiness: Confirm governance ownership and workflow candidates haven't drifted.
- Quarter 2: Re-measure adoption depth: Track task delegation, usage frequency, and role segmentation again.
- Quarter 3: Pair impact perception with outcomes: Run a labeled perception survey alongside business-metric tracking.
- Quarter 4: Adjust interventions: Use what changed to decide where training or governance needs attention next.
A repeatable structured survey makes that cadence practical instead of a fresh research project every time. AI Adoption Score offers nine predefined survey types covering usage, skills, barriers, culture, and perceived impact, meant to be run again as conditions change, not just once at kickoff.
Mapping results against a shared maturity scale gives the cadence a common language across teams, so a leader can see at a glance who's still at the readiness stage and who's already delegating real work.
The three stages of AI maturity, three instruments, one cadence: that's the whole framework. Stop asking one dashboard to answer three different questions, and start asking each stage the question it was actually built to answer.
Frequently asked questions
How often should each stage actually be re-measured?
A quarterly cadence works for most organizations for readiness and adoption, since governance ownership and usage patterns both shift as tools and training change. Impact metrics can run on a slower cycle, tied to whatever reporting period your business outcomes already follow.
Who should own AI adoption measurement inside a company?
Readiness sits with a small leadership group, often the Head of AI, CIO or CTO, and Chief People Officer, since it's a governance and infrastructure question. Adoption and impact measurement can be run by the same group but should involve managers close to the actual work.
Can a company skip readiness and jump straight to tracking adoption?
You can measure usage without checking readiness first, but the numbers will be hard to interpret. Without a named governance owner or reviewed workflows, low adoption could mean the tool is wrong, the training is missing, or nobody ever cleared it to use AI on real work.
Is self-reported survey data even worth collecting at the impact stage?
Yes, but only as one input, not proof of ROI. McKinsey's 2026 Global Survey and Gallup's February 2026 survey both show employees report meaningful productivity perceptions, yet those perceptions don't always match reported transformation or hold up against measured outcomes, so pair them with business metrics.
Sources: The State of AI: Global Survey 2026 | McKinsey, Rising AI Adoption Spurs Workforce Changes