

Test an AI adoption study in 45 minutes
Someone on your board has quoted an AI adoption study, and now you're asked, "Is that us?" Usually nobody has checked. This exercise gives you 45 minutes and one page to find out before the number lands in a strategy document.
The common habit is to borrow the rate from an AI adoption study as a benchmark. It's fast, and a good study does say something about the market. But a rate describes someone else's sample, definition and respondents. In our view, a published rate is a prompt for questions, not a target.
This is an editorial exercise, not a validated method, and it hasn't been run with any company. The task: write a one-page critique of one study you plan to cite, then draft your own questions. The inputs are below.
- Inputs: the one study you plan to cite, in full
- Inputs: a short profile of your company: sector, size, countries, roles
- Prerequisite: 45 minutes and one blank page
- Constraint: no conclusions about your adoption rate from their rate
- Constraint: figures you only saw second-hand stay labeled second-hand
The constraints matter as much as the steps. Don't draw conclusions about your own adoption rate from someone else's, and keep any figure you only saw second-hand labeled that way.
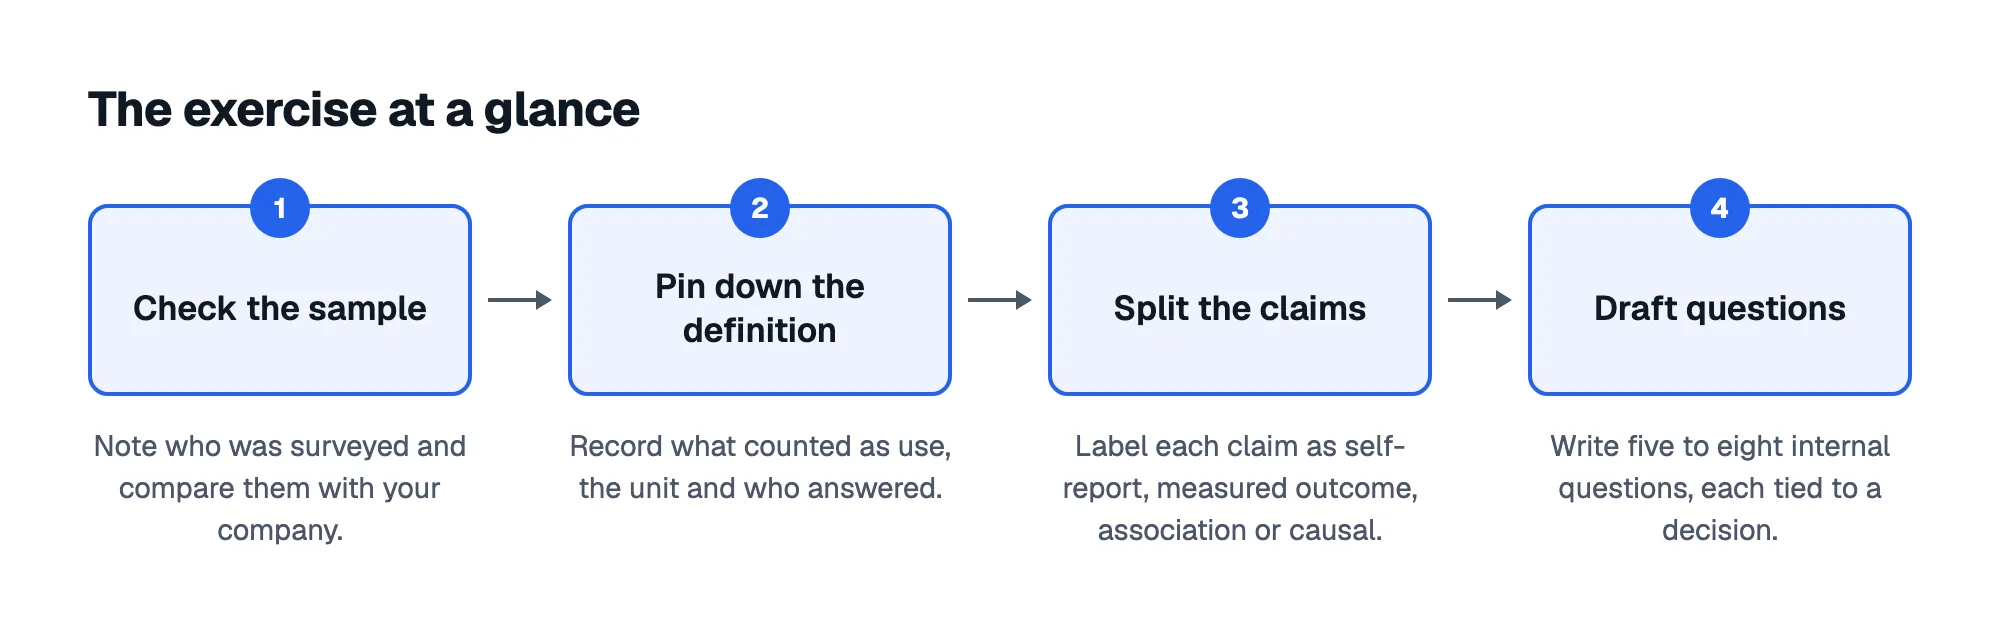
Step 1: Check who was sampled and counted
Start by recording who was surveyed, how many, when, and which sectors and firm sizes. Then compare that with your profile. AAPOR's 2013 task force on non-probability sampling said transparency about sampling, data collection and inference is essential, and that too many online surveys leave out adequate methodology information.
Sector can swing the answer. According to the Census Bureau's Business Trends and Outlook Survey, as of May 3, 2026, AI use among U.S. businesses in the Information sector was 39.7%, against a national rate of 19.8%. A bank or a manufacturer reading the average would misjudge where it stands.
Next, check what "use" meant and who answered. The Census authors report that the question wording changed in November 2025, and that BTOS put overall AI use at 17% to 20% for Dec 14, 2025 to May 3, 2026. A separate Census working paper (Nov 2025 to Jan 2026 supplement, U.S. firms) found 18% of firms used AI, but 32% on an employment-weighted basis.
Same survey family, different questions: one counts firms, the other counts the people who work in them.
| Question | Census example |
|---|---|
| What counted as use? | Wording was revised in November 2025 |
| Who is the unit? | 18% of firms, 32% employment-weighted |
| Who answered? | Firm respondents, not employees |
One critique of an AI adoption study shows the same trap. In an October 2024 X post, Arvind Narayanan argued that a 40% figure for generative AI use among U.S. adults counted occasional use, while the same paper reported 0.5% to 3.5% of work hours involved it. That's one critic's reading, and another commenter disputed it.
We'd put the unit and the definition at the top of your critique page, above the headline rate.
Sources: Large Firms With at Least 20 Employees Biggest AI Users, The Microstructure of AI Diffusion: Evidence From Firms, Business Functions, and Worker Tasks, https://aapor.org/wp-content/uploads/2022/11/NPS_TF_Report_Final_7_revised_FNL_6_22_13-1.pdf, Arvind Narayanan on X: "Here's an AI hype case study. The paper "The Rapid Adoption of Generative AI" has been making the rounds based on the claim that 40% of US adults are using generative AI. But that includes even someone who asked ChatGPT to write a limerick or something once in the last month… / X
Step 2: Split self-report from measured outcomes
Label every claim in the study: self-reported perception, self-reported behavior or measured outcome. Then mark which are associations and which come from causal designs. The Census working paper says its worker-use measures were reported by firm respondents rather than employees, so they reflect firms' assessments of worker behavior.
The paper also says its firm estimates and a 43% worker figure from Bick et al. (2026, Jan to Feb 2026) aren't directly comparable, because concepts, sampling frames, respondents and reference periods differ. That 43% is second-hand here.
Employee surveys, including ours, capture what people reported about their own practice. That's self-report, not proof that AI changed outcomes. Stanford's 2026 AI Index economy chapter says productivity gains are measurable within narrow tasks, while macro-level evidence is early and mixed.
Sources: The Microstructure of AI Diffusion: Evidence From Firms, Business Functions, and Worker Tasks, https://hai.stanford.edu/assets/files/ai_index_report_2026_chapter_4_economy.pdf
Step 3: Draft questions your company can answer
Now turn the gaps into five to eight internal questions covering frequency, tasks, skills, barriers, training and perceived impact. These are suggestions, not validated instruments. Adapt the wording to your roles.
- In the past week, on how many days did you use AI for work?
- Which tasks did you use it for?
- Which of those tasks could you now do without a colleague's help?
- What stops you from using AI more?
- Did training change how you do any task? Which one?
- How much time do you think AI saved you last week? (self-reported)
Give every question a decision. If barriers dominate, you fix access or conditions; if skills do, you fix training. Mark the time-saved answer as perceived impact, and repeat the same questions on a fixed cadence so you can see change in your own workforce.
Imagine a 300-person sales team where the question about tasks shows most reps use AI only for email drafts. That tells you where to point training, which no imported rate could.
AI Adoption Score uses short surveys to give a level for the company and every team and to show what holds people back, so you don't have to start from a blank page.
Finish when the page passes four checks
Your critique is done when it ticks these boxes. Each one is a completion criterion for the exercise, not a score of the study.
A suggested solution, using the Census BTOS papers as the worked example: the sample is U.S. businesses, the wording changed in November 2025, firm-weighted and employment-weighted figures answer different questions, and worker use came from firm respondents.
What does that mean for your company? It means you can't say "we're behind 20%." We're skeptical of any slide that tells you you're behind the market on the strength of one study's rate.
Sources: Large Firms With at Least 20 Employees Biggest AI Users, The Microstructure of AI Diffusion: Evidence From Firms, Business Functions, and Worker Tasks
Measure your own people, then repeat
Read an AI adoption study for its method, not its rate. Then ask your own workforce the questions the study couldn't answer for you.
Pick the one study your board cites and give it the 45 minutes this week.
Frequently asked questions
Who should write the one-page critique?
Whoever will cite the study: usually the Chief AI Officer's or digital transformation lead's analyst. Have one colleague from HR or L&D review it, since they know the workforce profile. This is editorial guidance, so adapt it to your team.
How often should we repeat the internal questions?
Pick a fixed cadence, such as quarterly, and keep the wording the same. Stable wording lets you compare your own results over time. Change a question only when you must, and note the change, as survey wording shifts can affect comparisons.
Can the internal survey prove AI is raising productivity?
No. Perceived time saved is what employees reported. To check a productivity claim, look at other evidence, such as before-and-after comparisons on specific tasks. Stanford's 2026 AI Index economy chapter says gains are measurable within narrow tasks, while macro-level evidence is early and mixed.
What if the study doesn't describe its sample?
Treat its headline number as unverified and say so in your critique. Ask the publisher for the sample size, dates, sector mix and question wording. If they can't supply them, use the study only for ideas about what to ask, not as a benchmark.
Sources: Large Firms With at Least 20 Employees Biggest AI Users, https://hai.stanford.edu/assets/files/ai_index_report_2026_chapter_4_economy.pdf