

A single AI usage dashboard can't average three vendors
A board member asks, "How many of our people actually use AI?" You open the Copilot, Gemini and Claude admin consoles and get three answers in three units. An AI usage dashboard that joins their exports can give you one view, if you're clear about what it measures.
Worklytics, a vendor, argued in September 2026 that admin reports from different tools count different things against different denominators, so their percentages can't be averaged. It's a vendor's framework, not documentation, but the warning holds. Build an activity layer: active days, one volume measure and the last activity date, per person per vendor. Don't sum prompts, requests and feature uses.
In our view, a single blended adoption rate is the vanity metric of multi-tool rollouts. Show each vendor next to the others instead.
The goal is concrete: one weekly table with a row per person and vendor. Before you export, check who can see what. Roles and user coverage differ by vendor, and some of that coverage is narrower than it looks.
| Vendor | Access you need | Coverage gap |
|---|---|---|
| Copilot | A role that can view usage reports; for Graph, Reports.Read.All plus an admin role such as Reports Reader or AI Administrator | Chat report covers users without a Copilot licence; Graph covers licensed users only |
| Gemini | A BigQuery project, specific admin roles, a service account as project editor, Reports administrator privilege | Usage reports and audit logs are distinct data sets |
| Claude | Spend export: Owner or Primary Owner; Analytics API: Primary Owner enables it and creates a read:analytics key | Analytics API is Enterprise only; Enterprise Admins can't view Spend |
Sources: Unified AI Tool Dashboard for Claude, Copilot & Gemini | Worklytics, Microsoft Copilot Chat Usage Report - Microsoft 365 admin | Microsoft Learn, copilotReportRoot: getMicrosoft365CopilotUsageUserDetail | Microsoft Learn, Set up service log exports to BigQuery | Reports & monitoring | Google Workspace Help, View usage analytics for Team and Enterprise plans | Claude Help Center
Steps 1–3: Export Copilot, Gemini and Claude

Work in this order. Microsoft's licensing split is the part most likely to catch you out.
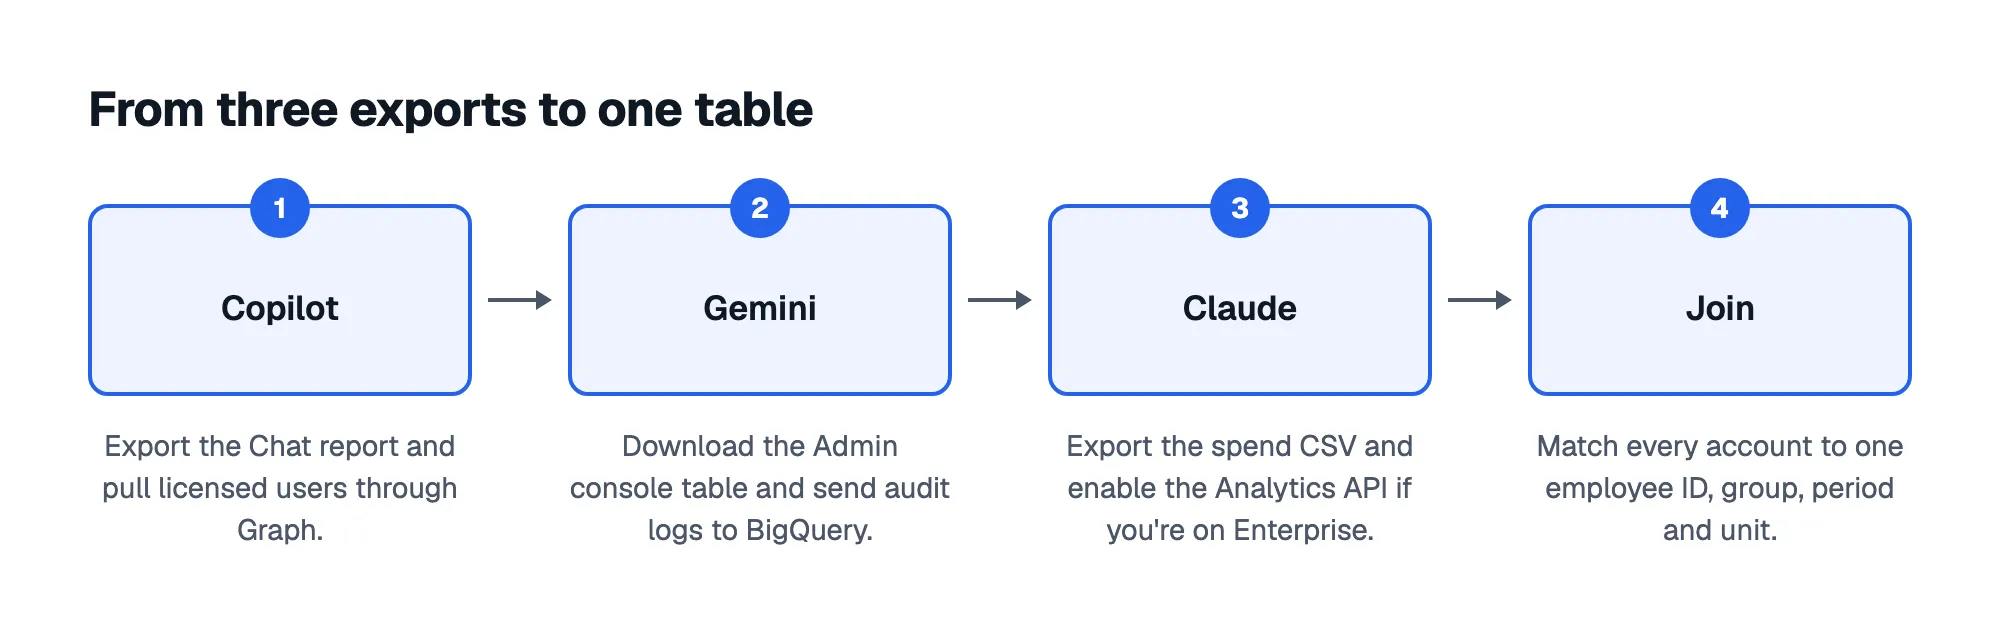
Step 1, Copilot. The Copilot Chat usage report in the admin centre has an Export button for CSV, but it covers only users without a Copilot licence. For licensed users, call the Microsoft Graph user-detail API. Its v2 report adds prompts submitted and active usage days, a better depth measure than last-activity dates. The /beta endpoints may change, so prefer v1.0.
Step 2, Gemini. The Admin console report sorts users into High, Medium, Low and Zero bands over 28 days, and you can download the table. It counts feature uses, not unique documents. For history, Google announced in August 2025 that admins can send Gemini audit logs to BigQuery; the steps below set that up.
- Create a BigQuery project and give a Workspace admin account the BigQuery Admin and Project IAM Admin roles.
- Add the Google reports service account to the project as an editor.
- In the Admin console, open Reporting, then Data integrations, with the Reports administrator privilege, and edit the BigQuery Export card.
- Tick the export box, choose the project, name a new dataset and save.
- Expect usage data after an initial 48-hour delay, then a lag of 1-3 days.
- Raise the table expiry above the 60-day default if you want longer history.
Step 3, Claude. On Team and Enterprise plans, Claude's usage analytics offer a spend export, a feed for a Claude usage dashboard: one CSV row per person per model, with requests and tokens, up to 90 days back.
Enterprise customers can use the Analytics API once the Primary Owner enables it and creates a read:analytics key. Tokens and requests make an input for an AI consumption dashboard: volume, not value.
We'd start with the CSV exports and add API pulls only once the first joined table survives a review with HR. Pipelines are cheap to build and expensive to untangle. This guide doesn't cover ChatGPT or an OpenAI usage dashboard.
Sources: Microsoft Copilot Chat Usage Report - Microsoft 365 admin | Microsoft Learn, copilotReportRoot: getMicrosoft365CopilotUsageUserDetail | Microsoft Learn, Set up service log exports to BigQuery | Reports & monitoring | Google Workspace Help, Google Workspace Updates: Export Gemini Audit logs to BigQuery, Review Gemini usage in your organization | Generative AI | Google Workspace Help, View usage analytics for Team and Enterprise plans | Claude Help Center, https://platform.claude.com/docs/en/manage-claude/analytics-api
Step 4: Join on one person, one period

Start with the HR roster, not the charts. Work through these steps in order, and don't plot anything until the first three are done.
- Get the HR roster with one employee ID per person.
- Map every vendor account to that ID, using email or principal name.
- Check whether Copilot reports are anonymized, and settle that with HR first.
- Choose one comparison group, such as department headcount.
- Choose one weekly snapshot day for every vendor.
- Choose one unit: active days plus one volume measure.
The finished AI usage dashboard is a table of activity. Each row is a person and vendor, with three fields. Field names differ by vendor, so verify them in your own exports. The documentation behind this guide describes no last-activity field for Gemini's band report or Claude's spend export, so leave those cells empty rather than inventing them.
| Vendor | Active days | Volume | Last activity |
|---|---|---|---|
| Copilot | Active usage days (Graph v2) | Prompts submitted | Last-activity date |
| Gemini | 28-day usage band | Feature-use count | Not documented |
| Claude | Not documented | Requests and tokens | Not documented |
Our advice: report at team level with minimum group sizes, and don't show individual scores to managers. The rows below are a hypothetical illustration with invented values, showing the shape of the output, not real data.
| Employee ID | Vendor | Active days | Volume | Last activity |
|---|---|---|---|---|
| E1042 | Copilot | 9 | 31 prompts | 2026-10-08 |
| E1042 | Claude | Not available | 140 requests | Not available |
| E2210 | Gemini | Medium band | 12 feature uses | Not available |
Sources: copilotReportRoot: getMicrosoft365CopilotUsageUserDetail | Microsoft Learn, Track Microsoft 365 Copilot readiness and usage across your organization - Training | Microsoft Learn, Review Gemini usage in your organization | Generative AI | Google Workspace Help, View usage analytics for Team and Enterprise plans | Claude Help Center, Unified AI Tool Dashboard for Claude, Copilot & Gemini | Worklytics
Expect lags, masked names and short retention

Most join problems come from a handful of causes. Check these before you doubt the data.
- Lags: the Copilot Chat report typically appears within 48 hours of the UTC day's end, while Microsoft's training module gives 72 hours for the licensed usage report; BigQuery lags 1-3 days after an initial 48 hours; Claude has a one-day delay.
- Masked names: a Global administrator can anonymize Copilot reports, hiding names, emails and Entra object IDs, which blocks person-level joins.
- Short retention: BigQuery exports expire after 60 days by default, and the Claude spend export reaches back up to 90 days.
- Licensed-only data: Graph excludes unlicensed Copilot Chat users, so we'd combine both Copilot sources.
Pick the slowest lag as your reporting rule and print it beside every chart. Settle the masking question with HR and your data protection officer before you build, not after.
Our bet is that retention, not export, is what teams regret skipping. Set the expiry before you need a trend line.
Sources: Microsoft Copilot Chat Usage Report - Microsoft 365 admin | Microsoft Learn, copilotReportRoot: getMicrosoft365CopilotUsageUserDetail | Microsoft Learn, Track Microsoft 365 Copilot readiness and usage across your organization - Training | Microsoft Learn, Set up service log exports to BigQuery | Reports & monitoring | Google Workspace Help, View usage analytics for Team and Enterprise plans | Claude Help Center
Usage bands don't show skill or barriers
Worklytics, a vendor, said in September 2026 that native Copilot exports show activity, not value. Anthropic describes its Claude Code contribution metrics as deliberately conservative and an underestimate of actual impact, and they need a GitHub integration. Read both as activity views.
Gemini's High, Medium, Low and Zero bands are Google's thresholds, not skill levels. We're skeptical of any dashboard that calls a heavy-usage band skilled. A band is a count of uses.
Skill, barriers and perceived impact need a different instrument. Claude's in-product Surveys option asks users directly, but only about Claude. Worklytics, writing in July 2026, argues for behavioral data over surveys and says self-reported surveys measure confidence rather than capability. Survey answers show what employees report, not causal productivity or measured skill.
Sources: Review Gemini usage in your organization | Generative AI | Google Workspace Help, View usage analytics for Team and Enterprise plans | Claude Help Center, Track team usage with analytics - Claude Code Docs, How to Export & Analyze M365 Copilot Usage Data | Worklytics, How to Measure AI Skills Across Your Workforce Beyond Survey | Worklytics
Add the survey your logs can't replace
Treat the dashboard as an activity layer and label every chart that way. Then ask people about what logs can't see: skills, barriers and perceived impact, by team.
AI Adoption Score uses predefined employee surveys, with guidance on which one to start with. They cover skills, usage habits and the barriers holding a team back, so you can choose between training and unblocking by team.
Build the usage table this month. Then ask your people why the numbers look the way they do.
Frequently asked questions
Who should own a cross-vendor AI usage dashboard?
Our advice: give it to one named owner, usually IT or a data team, with HR as a required partner. HR holds the roster that makes joins possible, and your data protection officer should approve how identities are handled before the first export is built.
How often should we refresh the dashboard?
We'd refresh weekly on a fixed snapshot day, so every vendor sits on the same calendar. Google says Gemini usage reports can take 2-3 days to show the latest data and BigQuery usage lags 1-3 days, while Claude's spend export runs one day behind. A daily refresh would mix freshness levels. That's our judgment.
What if Copilot anonymization has to stay on?
Treat Copilot as a separate, team-level panel. The admin report still gives aggregate figures such as active users and average prompts per user, so show those beside the Gemini and Claude views and skip a row-level join for Copilot until HR agrees a change.
Can the dashboard prove AI improves productivity?
No. Activity counts can't establish impact. If leaders need an impact claim, define the outcome first, such as cycle time, compare similar teams at different rollout stages, and describe the result as an association, not proof.
Sources: Set up service log exports to BigQuery | Reports & monitoring | Google Workspace Help, Review Gemini usage in your organization | Generative AI | Google Workspace Help, View usage analytics for Team and Enterprise plans | Claude Help Center, Microsoft Copilot Chat Usage Report - Microsoft 365 admin | Microsoft Learn, Track Microsoft 365 Copilot readiness and usage across your organization - Training | Microsoft Learn