

Build an AI readiness index you can actually explain
Picture your CPO asking why your AI readiness index dropped ten points this quarter, and the only answer you have is "that's what the vendor's dashboard says." You can't explain the number, so you can't defend it, and you certainly can't act on it.
Most companies solve this by buying a packaged readiness score: answer a vendor's questions, get a number, done. That buys speed and an external benchmark claim. It doesn't buy you a formula you can open, challenge, or adapt when your next survey wave changes what you're asking.
We think a score you can't explain is worse than no score at all. Build your own AI readiness index from employee survey data, not around someone else's weights.
Start with what the term itself means, since "AI readiness index" gets used loosely across vendor marketing and research alike.
“a framework or measurement tool designed to assess how prepared an organization, country, or system is to adopt, integrate, or responsibly govern artificial intelligence”
— Adnan Masood, PhD., AI/ML PhD, Microsoft Regional Director, Stanford Scholar · Source: Dimensions of AI Preparedness — A Comparative Assessment of Artificial Intelligence Readiness Indices | by Adnan Masood, PhD. | Medium
This is a practitioner's build guide: the seven steps, borrowed from an established statistics methodology and adapted to your employee survey data instead of a country ranking, plus where homemade indexes usually break.
What you need before you start

Before you build an AI readiness index, you need four things on hand: a completed cycle of employee survey responses, a draft list of five to eight readiness categories, a spreadsheet or stats tool that can calculate correlations, and one leader willing to sign off on how categories get weighted.
Start with categories, not questions. If you'd rather begin from a predefined set than draft every item from scratch, AI Adoption Score's nine predefined survey types already split out usage, skills, barriers, culture and more — you'd still own the weighting and scoring logic yourself. Otherwise, sketch your own categories first, then write questions for each one.
| Category | What it measures | Example signal |
|---|---|---|
| Usage | How often and for what tasks people use AI | Frequency and task type employees report |
| Skills | Practical ability to use AI tools well | Self-rated skill level per task |
| Barriers | What's stopping wider adoption | Named blockers like time, trust or access |
| Culture | Openness to sharing AI knowledge | Frequency of peer AI knowledge sharing reported |
| Governance | Clarity on acceptable AI use | Awareness of a written AI policy |
| Training effectiveness | Whether training changed behavior | Self-reported behavior change after training |
Seven steps that turn survey answers into one score

The clearest structure for building any composite score doesn't come from HR. It comes from the OECD and the European Commission's Joint Research Centre, whose 2008 Handbook on Constructing Composite Indicators lists developing a theoretical framework and then selecting variables as its first two steps. That's a practical AI readiness assessment methodology you can adapt from country rankings to employee survey data.
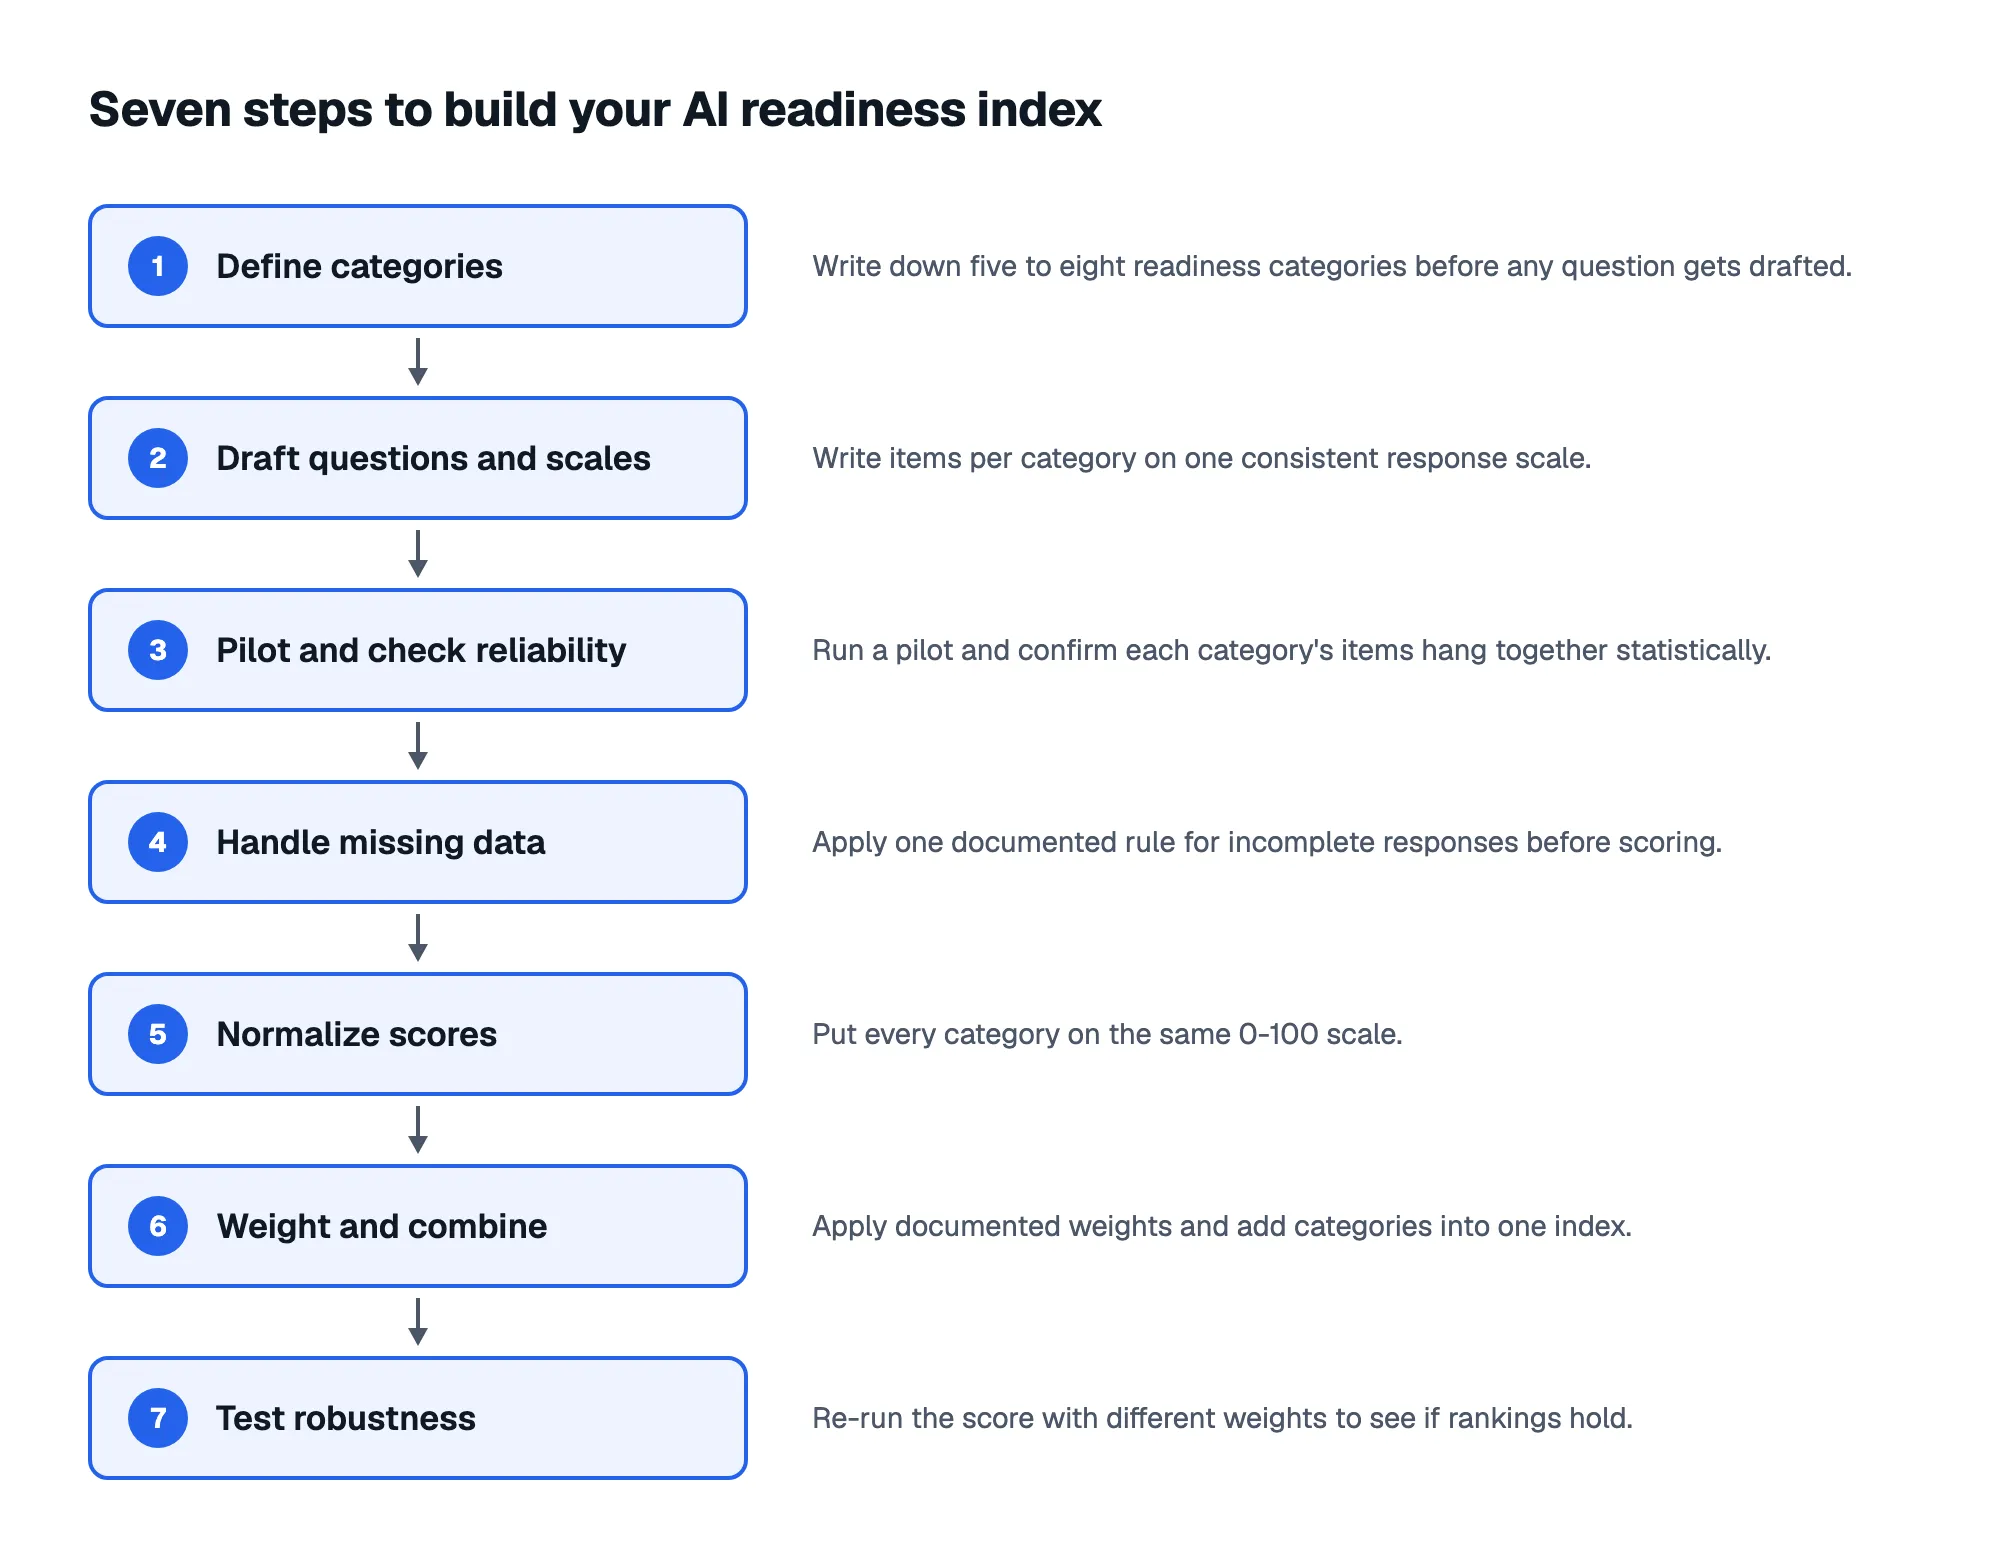
Keep the answer scale identical across every category: four or five options at most, according to Pew Research Center's survey-design guidance. Pew's own experiment found that phrasing a question as forced-choice produced a noticeably different overall result than phrasing it as agree-disagree for the same statement, so pick one format and don't switch mid-survey.
Before you trust a category score, check whether its questions actually move together.
In the 2017 Faculty Survey of Student Engagement, covering 24,418 faculty at 154 bachelor's-granting colleges, the study's own reliability analysis found Cronbach's alphas between .73 and .94 across its ten scales, all above its .70 threshold — a reasonable bar for any multi-item category, AI readiness included. Run a similar check before you trust any category score in your own index:
Decide your missing-data rule before data arrives: the Handbook treats imputing missing responses as its own explicit step, separate from scoring. Once every category has a complete, comparable set of answers, normalize them onto the same scale — the Handbook lists standardization, or z-scores, as one option, so each category counts equally regardless of its original range.
Weighting is where most teams freeze or fudge it. The Handbook's aggregation step combines normalized indicators additively once weighted, and Cisco's 2024 AI Readiness Index shows one vendor's split — Strategy 15%, Infrastructure 25%, Data 20%, Governance 15%, Talent 15%, Culture 10% — drawn from its double-blind 2024 survey of 7,985 senior business leaders with AI integration responsibilities.
We'd start every DIY index with equal weights across categories and only tilt them once a second survey wave gives you a reason to.
Finally, test what happens if you drop a category, swap a weight, or change the normalization method. The Handbook calls this robustness and sensitivity testing, a step most homemade indexes skip entirely. If rankings flip from a five-point weight change, the score isn't stable enough to defend to your board. Treat whatever comes out as a read on survey responses, not proof that readiness caused any result.
Sources: Handbook on Constructing Composite Indicators: Methodology and User Guide (EN), https://online225.psych.wisc.edu/wp-content/uploads/225-Master/225-UnitPages/Unit-11/Pew_SurveyDesign_NoDate.pdf, https://scholarworks.iu.edu/dspace/bitstreams/78eb43e3-93f1-49ed-87d0-2f8818c7b6ef/download, Cisco AI Readiness Index
What a usable index looks like

A usable AI readiness index gives you a score per category you can trace back to specific questions, not one blended number. You should be able to point to Skills and say exactly which three items produced a 62, and why Governance sits ten points lower.
- A per-category score plus the overall index, shown side by side
- Raw question-level data kept for drill-down, not discarded after scoring
- A documented weighting formula published next to the score
- Perceived-impact questions tracked separately from usage and skills data
That traceability matters because most organizations have nowhere to send it: in Cisco's 2025 AI Readiness Index, only 32% of surveyed organizations reported having a process to measure the impact of their AI initiatives. Concrete adoption metrics examples — usage frequency by task, perceived time saved, barrier counts per team — give that missing process something to track.
We're skeptical of folding perceived-impact questions into the same blended score as usage data; the two measure very different things.
Sources: Cisco AI Readiness Index 2025 - Realizing the Value of AI
Where DIY readiness indexes break down
Most of what goes wrong with a homemade index shows up fast once real data arrives. Here's what to check and what to do about it.
- A category's reliability check comes in weak: drop or rewrite the weakest question instead of lowering your bar.
- Rankings flip when you nudge one weight: the index isn't ready to present yet.
- Response rates are uneven across teams: check for skew before blending scores into one number.
- Leadership wants a single number for the board: give them the index plus the category breakdown, not instead of it.
None of these are reasons to abandon a DIY index. They're reasons to test it before you publish it.
Build your own score, don't rent a black box

Vendor AI readiness index products trade transparency for speed. They lock you into someone else's variable list and weights. Many teams default to trusting an established vendor because its weights look rigorous. We're less convinced: a published formula you built from your own employees' answers is more defensible in a board meeting than borrowed weights you can't fully explain.
| Dimension | Vendor index | Internal index |
|---|---|---|
| Weighting logic | Fixed by the vendor | Set and documented by you |
| Variable list | The vendor's own | Categories you chose for your survey |
| Update cycle | The vendor's release schedule | Every survey wave you run |
| Explainability to your board | A vendor methodology page | Your own documented formula |
You don't need a statistics background to build a transparent AI readiness index — you need a documented framework, consistent scales, and the discipline to test it before you trust it. Run the seven steps once, publish the formula next to the score, and let your next wave confirm whether the weights still hold.
Frequently asked questions
How often should you re-run the AI readiness index?
Re-run it with every full survey wave, typically each quarter or two, so you can compare category scores over time and catch any weight that needs revisiting. Running it less often makes the robustness checks less useful, since you won't have fresh data to confirm the ranking still holds.
Who should own the weighting decisions?
One accountable leader, usually the Head of AI or a CPO, should sign off on category weights, even if an analyst or L&D team builds the index itself. Documenting who approved each weight change makes the score defensible later, when someone asks why it moved.
Can you build this in a spreadsheet, or do you need statistics software?
A spreadsheet handles most of it: averages, standardization, even basic correlation checks. Formal reliability testing, like calculating Cronbach's alpha across category items, is easier in dedicated statistics software, but a spreadsheet template with built-in formulas can approximate it for a first version.
What's a reasonable number of readiness categories to start with?
There's no fixed number — it's a trade-off between coverage and survey fatigue. Add a new category only once you have a clear question set for it, and prioritize the one tied to your most urgent decision, such as barriers if adoption has stalled, before adding categories that are merely nice to track.
Sources: https://scholarworks.iu.edu/dspace/bitstreams/78eb43e3-93f1-49ed-87d0-2f8818c7b6ef/download