

Logins tell you who tried it, not who adopted it
Your board asks, "So what is AI adoption here, and how do we know it's happening?" You open the licensing report. Seats are assigned, logins climb every month, and nobody in the room quite believes that curve answers the question.
They're right to doubt it. In its 2026 vendor survey, Gallagher, an insurance broker, counted businesses that had either fully operationalized AI or implemented it within parts of the business. That bar is loose, because "within parts" can describe a single team running a pilot.
In our view, a rising login curve is a comfort metric, not an adoption metric. A login says someone opened a tool; it can't say whether anyone changed how they work.
This AI adoption guide takes a different route. Count licenses as the denominator, then measure habit, breadth and spread of use, add a short survey for what logs can't see, and read everything as a trend. The sections below build that set in order.
Sources: 2026 AI Adoption and Risk Benchmarking | Gallagher
What is AI adoption inside an organization?
Most definitions start from public statistics, and those answer a narrower question than the one you're facing. They ask whether an organization uses AI at all. You need to know whether people use it often enough, and well enough, to matter.
So what is AI adoption inside a company? Our working definition: people using AI tools repeatedly and on purpose in real tasks, with the skills, permission and trust to keep doing so. It's not a standard, and none of the sources used here validates a single definition of employee-level adoption.
Each part of that definition is something you can check. "Repeatedly" and "on purpose" point to usage data. Skills, permission and trust point to a survey. Licenses only tell you who could use the tool.
Sources: AI use by individuals surges across the OECD as adoption by firms continues to expand
Firm-level counts show whether, not how deeply
According to the OECD's 2025 firm data, published in January 2026, 20.2% of firms across OECD countries with available data reported using AI, up from 14.2% in 2024 and 8.7% in 2023.
That's a yes-or-no indicator per firm. A company with one analyst experimenting counts the same as one with AI in every workflow. The OECD's individual-level data for 2025 put generative AI use among people in employment at 41.1%, but that describes the wider population, not necessarily work or employer tools.
Use these numbers as context for board conversations, not as targets. When a peer says "we're well above average," ask what sits in the numerator: one team, one tool, or most of the workforce?
Sources: AI use by individuals surges across the OECD as adoption by firms continues to expand
Adoption is uneven by size and sector
The OECD's January 2026 announcement reported large gaps by firm size and industry for 2025. The table sets those shares side by side.
| Group | Share using AI | Year |
|---|---|---|
| All firms | 20.2% | 2025 |
| Large firms | 52.0% | 2025 |
| Small firms | 17.4% | 2025 |
| ICT firms (highest industry) | 57.3% | 2025 |
An OECD working paper from 2025, which cites OECD and Eurostat figures for 2024, found the same pattern: 39% of large firms in the OECD area used AI, compared with 12% of small firms. It's a working paper, so it doesn't represent official OECD views.
The same unevenness lives inside your company. Imagine a 300-person business where the data team uses AI daily and the finance team hasn't opened it. The company average looks respectable and tells you nothing about where to act, and industry averages hide variation within organizations too.
Sources: AI use by individuals surges across the OECD as adoption by firms continues to expand, Emerging divides in the transition to artificial intelligence (EN)
Measure habit, breadth and spread, not seats

Once licenses are the denominator, three questions replace the login count. How often do licensed people use AI, how many of the people who could benefit do, and how evenly is use spread? Two vendor documents show how to build answers. Neither is a standard, and both are tied to one product.
Microsoft's documentation scores licensed users over a rolling 28-day window, while Kilo's documentation weights frequency, depth and coverage for engineering teams. Both start from what people do rather than what they were given. The next two subsections take each in turn.
Sources: AI Adoption Category in Adoption Score - Microsoft 365 admin | Microsoft Learn, Understanding Your Score
Frequency: a daily-habit score in practice
Microsoft's documentation defines its Copilot adoption score as the extent to which people use Copilot as a daily habit. A score of 100 means licensed users average at least three active days per week, or 12 of 28 days.
Here's the documented calculation. For each licensed user, count the active days out of the prior 28 and divide by 12. Eight active days gives (8/12) × 100 = 66.67 for that person. The organization's score is the average across all licensed users.
Two design choices stand out. The score counts only intentional user actions, and only for licensed users, over a rolling 28-day window. That makes it an activity-based alternative to counting seats. It covers Copilot in listed Microsoft 365 apps only, so it says nothing about other tools, skill or quality.
Microsoft also documents a peer benchmark built from similar organizations by region, industry and licensed-user count, plus trends over 30, 90 and 180 days. We'd borrow the logic, not the threshold: three active days a week suits some roles and would be an odd target for others.
Sources: AI Adoption Category in Adoption Score - Microsoft 365 admin | Microsoft Learn
Depth, coverage and distribution
Kilo's documentation, from a coding-tool vendor writing about engineering teams, describes a 0 to 100 score built from three weighted dimensions: frequency at 40%, depth at 40% and coverage at 20%. The weights are the vendor's design and haven't been validated against outcomes.
The most transferable advice is to read the distribution, not the average. Kilo's own illustration says a team scoring 50 could be half at 80 or above and half at 20. Same average, two very different teams, and two different interventions.
Kilo also advises watching direction over absolute scores, and using individual scores for personal development rather than performance evaluation. Follow that second rule: treat individual data as a way to find who needs support.
The table turns these ideas into a starting set. It's an editorial suggestion, not a validated model.
| Measure | Question it answers | Example signal |
|---|---|---|
| Frequency | How habitual is use? | Active days in a rolling 28-day window |
| Breadth | How many of the target group use it? | Share of a team or role active in the period |
| Depth | Does use reach real work? | Share of key tasks where AI is used, defined by you |
| Distribution | Who is ahead and who is absent? | Spread of scores across people within a team |
| Trend | Is it moving? | Same measures over 30, 90 and 180 days |
Sources: Understanding Your Score
Skills, trust and governance decide whether use sticks
Activity data shows what people do. It can't show why they stop. For that you need to ask about skills, barriers, trust and rules, because those are the conditions that turn a trial into a habit.
Skills gaps are the barrier leaders name most
Deloitte's survey of 3,235 senior leaders in 24 countries, fielded in August and September 2025, found that insufficient worker skills was the biggest barrier to integrating AI into workflows. The sample leans toward organizations at the leading edge of AI, so don't read it as every firm.
In the same survey, 53% of leaders said they were educating the broader workforce to raise AI fluency, while far fewer were re-architecting roles. That describes what leaders say they do, not whether it worked. An OECD working paper from 2025 adds that firms cite skills shortages, cost and technology lock-in as major obstacles.
Notice the gap. Training is the popular response, yet "skills gap" is too blunt to act on. Which skills, in which teams, for which tasks?
We'd push back on the reflex to answer a skills gap with a course catalog: until you know which teams are stuck and why, training spend is a guess. Ask people first. These are suggested questions, not a validated instrument:
- Which task last week could AI have helped with, and what stopped you?
- How confident are you checking AI output before you rely on it?
- Do you know what you're allowed to do with AI at work?
- Has any training changed how you do a specific task?
- Who do you ask when AI output looks wrong?
Some teams will prefer a ready-made option. AI Adoption Score's AI Adoption Barriers Survey is built to uncover the real reasons a team isn't using AI more effectively, so you can weigh training against tooling and policy fixes.
Sources: The State of AI in the Enterprise - 2026 AI report | Deloitte US, Emerging divides in the transition to artificial intelligence (EN)
Governance, trust and communication
Deloitte's 2025 survey of leaders also reported that only one in five companies has a mature governance model for autonomous AI agents. That's self-assessed maturity and specific to agentic AI, but it hints at a broader question you can ask about your own rules.
Governance isn't only a compliance matter. Treat it as a usage question: do people know what's allowed, who to ask, and what happens when output is wrong? Uncertainty there can look like low use in your logs, and the logs won't tell you which it is.
Gallagher's Sonya Poonian, Director of AI Transformation, Employee Engagement and Communication Consulting, made the people point in the insurer's 2026 AI Adoption and Risk Survey feature, a vendor source:
“You need to be building skills, confidence and trust to enable the workforce to be using AI on a day-to-day basis”
— Sonya Poonian, Director of AI Transformation, Employee Engagement and Communication Consulting, Gallagher · Source: 2026 AI Adoption and Risk Benchmarking | Gallagher
Our suggestion, not a research finding: track trust and confidence with a few survey items on trust in current tools, comfort with the rules and confidence about the future, beside active days. If your low-use teams are also the least confident, that's a different problem from teams that simply lack a use case.
Sources: The State of AI in the Enterprise - 2026 AI report | Deloitte US
Use surveys for what logs can't see

Logs show behavior. They don't show whether someone has the skills, whether training helped or whether a tool feels worth the effort. A short employee survey covers that ground, and Microsoft's documentation pairs its behavioral data with exactly this kind of sentiment survey.
Microsoft's version uses four agree-or-disagree statements about quality, mental effort, speed and productivity when using Copilot. Those capture how people experience their work. Employees reporting faster work is perception, not causal proof of productivity, and that holds for any survey, including ours.
Leader reports need the same care. In Deloitte's 2025 survey of 3,235 senior leaders, drawn from organizations on the leading edge of AI, most said their organizations had seen productivity and efficiency gains from AI.
We're skeptical of any ROI slide built only on reported gains. If you need to claim a return, pair the perception data with a baseline outcome measure:
Surveys also repeat well. Ask the same questions each quarter, read results by team and role, and you can see whether a barrier is shrinking. A single score is a snapshot; a trend shows direction.
Sources: AI Adoption Category in Adoption Score - Microsoft 365 admin | Microsoft Learn, The State of AI in the Enterprise - 2026 AI report | Deloitte US
Build a measurement set you can repeat
Here's the loop we'd start with, as editorial advice. It pairs usage data from your tool admin consoles with the survey items above.
Run the loop below on a fixed cadence, and keep the questions the same each time. Read results by team, role and group size, and be careful with very small groups, where an average can point at one person.
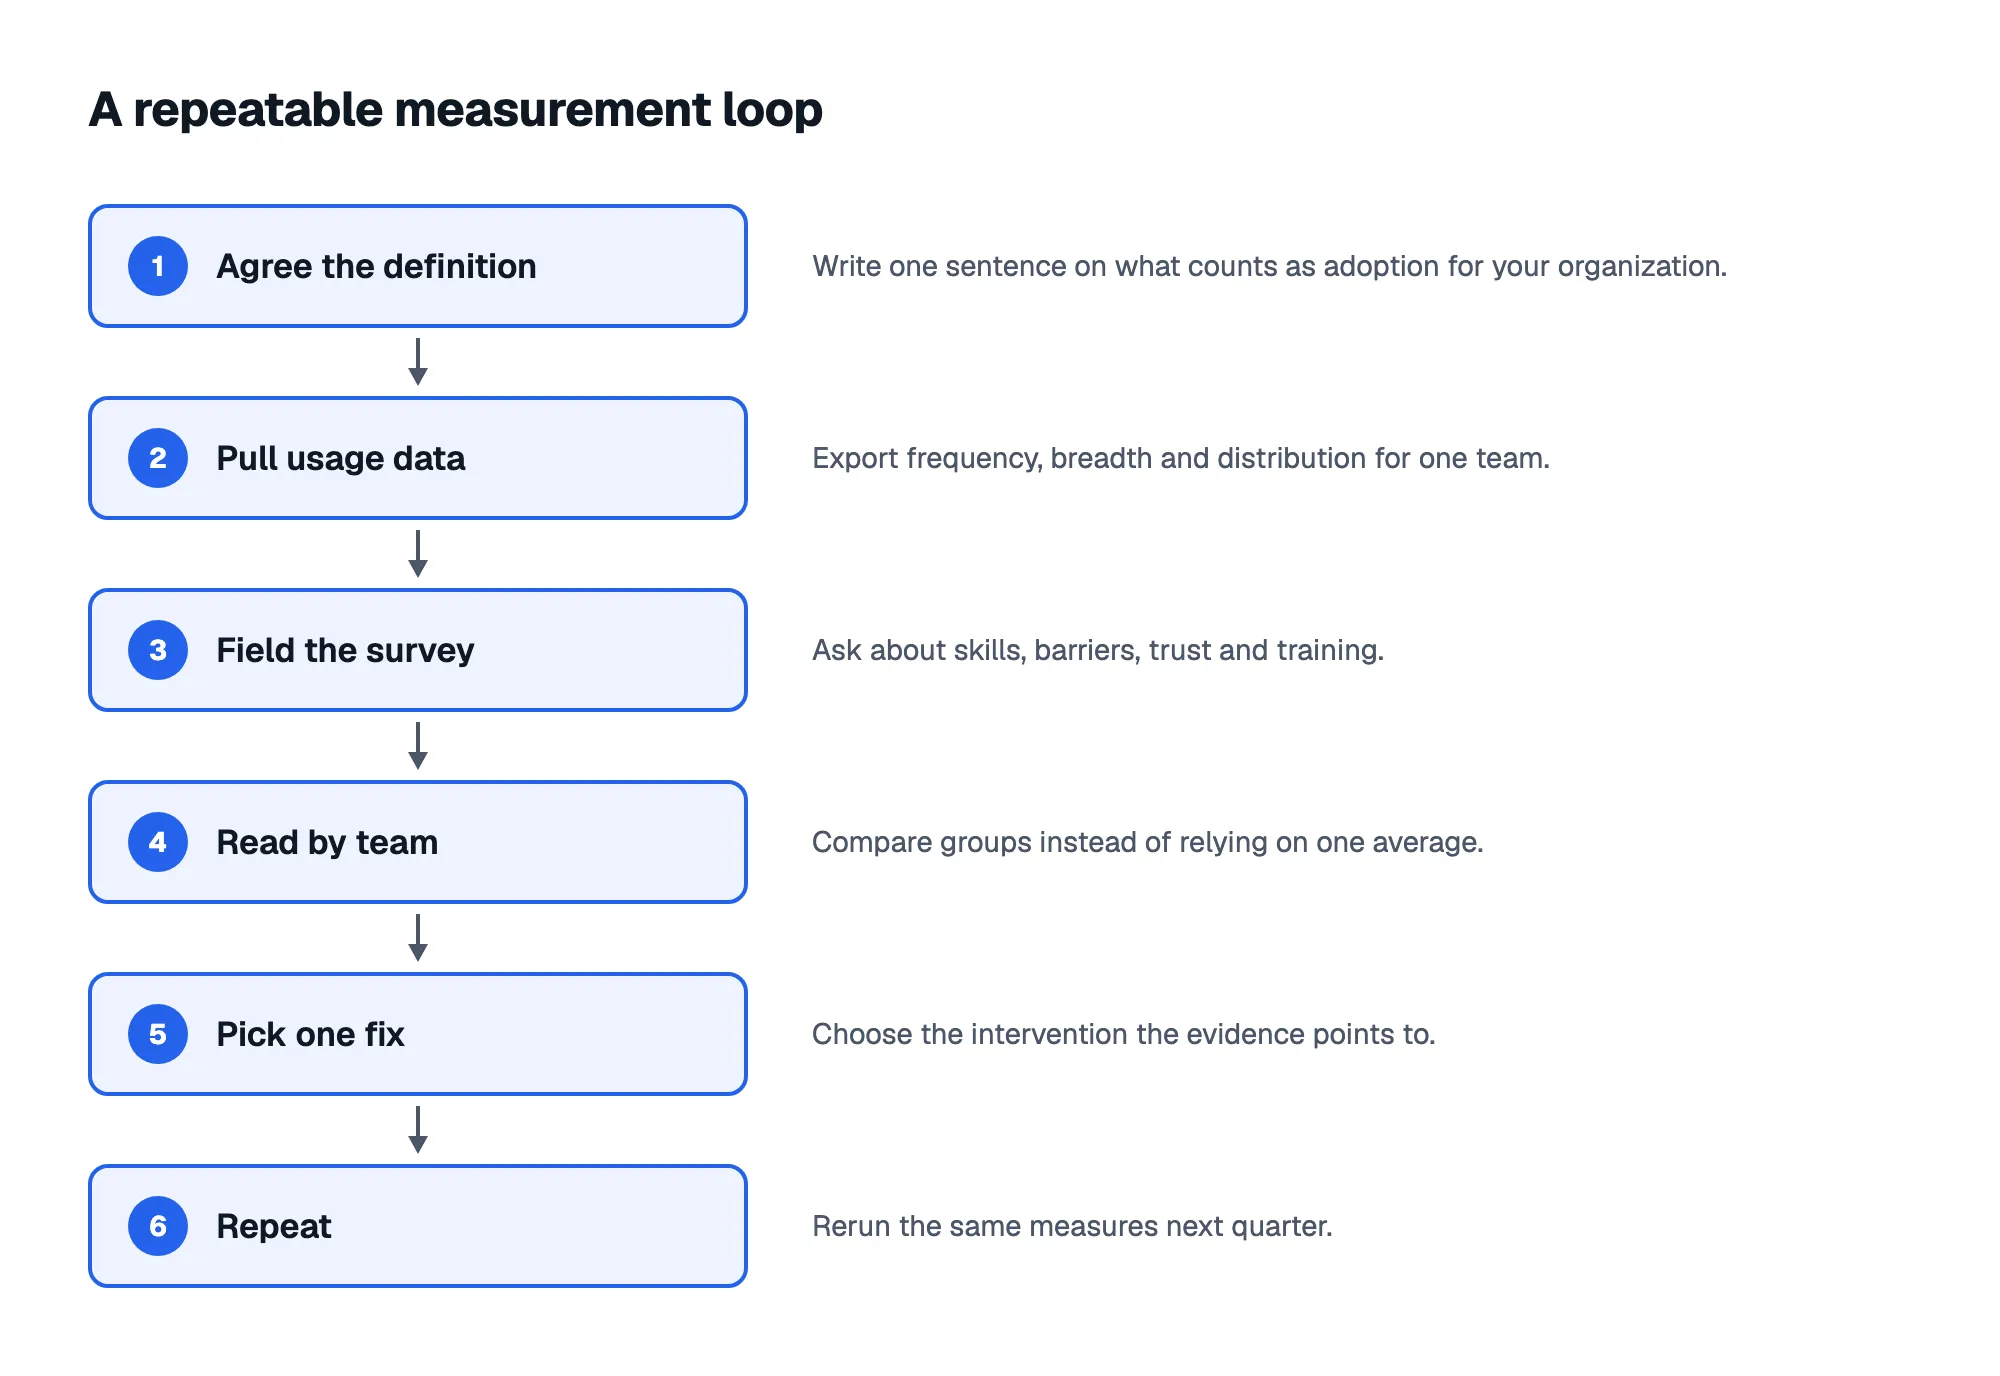
Imagine a 40-person engineering team scoring 50 on a frequency score. The distribution shows half the team near 80 and half near 20, and the survey says the low group is unsure what the rules allow. The fix is a clear policy conversation with that group, not a team-wide course.
If you'd rather not build the survey side yourself, AI Adoption Score uses predefined surveys, with guidance on which one to start with. They cover AI usage, skills, readiness, barriers, culture, governance and training effectiveness.
Adoption shows up in repeated use, not seat counts
What is AI adoption, once you strip out seat counts? It's repeated, intentional use in real work, backed by skills, clear rules and trust, and you see it in distributions and trends rather than one average.
Pick the team where the board's question is sharpest, measure it both ways, and report what you find with honest labels. That beats any seat count.
Frequently asked questions
Who should own AI adoption measurement?
Name one accountable owner, such as the Head of AI, Chief AI Officer or digital transformation lead, and bring in L&D and HR early. That's our suggestion, not a researched rule. Usage exports and survey follow-up may sit with different teams, so one owner keeps definitions and cadence consistent.
Do we need usage data from every AI tool?
No. Start with the one or two tools most people are licensed for, and write down which tools your numbers leave out so nobody reads the result as company-wide. Add sources later, once a survey answer points to a tool you can't see.
How many survey questions are enough?
Fewer than you'd think. Our sources give no validated number, so this is editorial advice: start with a few items each on skills, barriers, trust and training, and keep the wording stable so quarters compare. Add a question only when an answer raises something you can't explain.
How small can a team be before results mislead?
There's no validated cutoff in our sources. As a rule of thumb, be cautious with groups so small that one person's answer shifts the average or identifies them. Combine related teams, or report distributions across a larger role group instead.